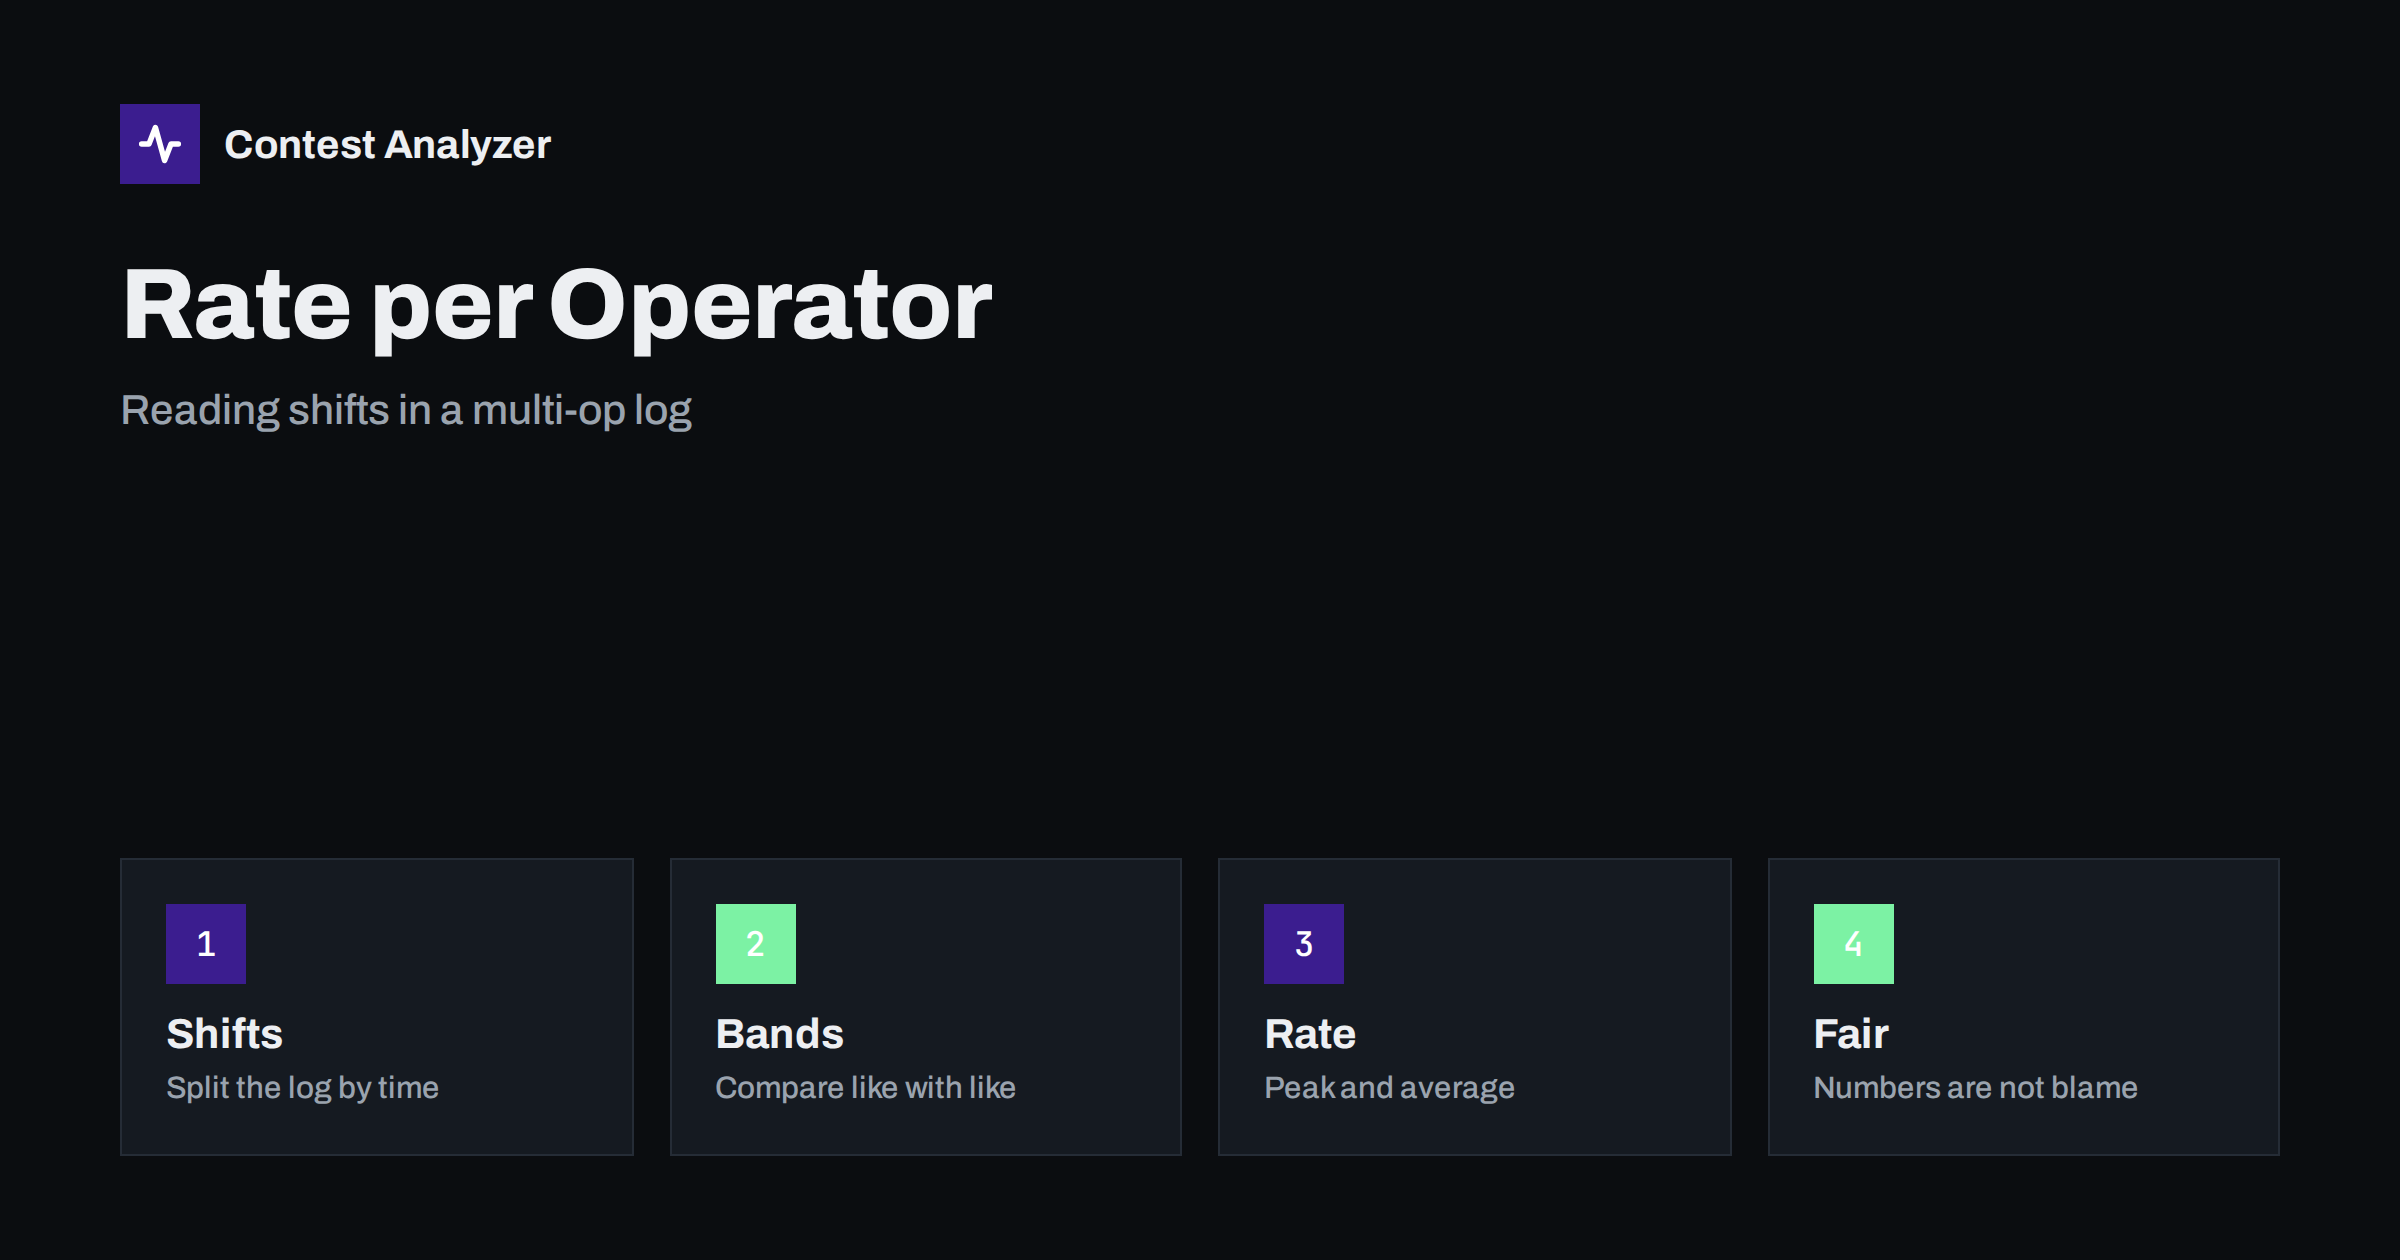
Short answer: In a multi-operator entry the log shows what the station did, and with a little work you can see what each operator or shift contributed. Split the log by shift, compare rate on the same band and the same kind of conditions, and look at both the average and the peak. Use the numbers to plan the next contest and not to blame a person, because conditions change faster than people do.
Why look at rate per operator
A multi-operator station has several people sharing a few seats. The total score tells you how the team did, but it hides a lot: who ran well on the first night, who found the multipliers, who carried the weak hours. When you split the log into shifts and look at each one separately, you get a picture that helps the team to plan better. The goal is to put the right person on the right band at the right time, and to give everyone a fair share of the hours that are easy and the hours that are hard.
This kind of analysis is not about ranking friends. A lower rate in a shift can mean that the operator was unlucky with propagation, that the band was crowded or that the shift was at a quiet time of the day. The numbers are a starting point for a conversation, and not an answer by themselves. The article on contest rates and QSOs per hour explains the basic ways of reading rate that are used here.
What you need in the log
The first requirement is that the log tells you who operated. Many loggers have a field for the operator, and in a multi-operator contest it is good practice to fill it in at every change of seat. If the field is empty, you can still reconstruct the shifts from the schedule that the team wrote down, because the time of each QSO is in the log. Keep that schedule with the log files, with the times in UTC, so that you can match it to the QSOs later.
The second requirement is a clean merge of the logs from all computers. If the station used several computers, the merged file must contain all QSOs once, with the right time and band. The article on merging logs from several computers and the one on errors that appear when you merge multi-op logs show what to check. If the merged file has gaps or duplicates, the rate per operator will be wrong.
Average rate and peak rate
For each shift, count the QSOs and divide by the length of the shift to get an average rate. Then look at the best hour or the best ten minutes to find the peak rate. The two numbers tell different stories. A high average with a low peak suggests steady work. A high peak with a low average suggests a few good runs between long slow periods. Both are useful, but they answer different questions: the first tells you how the shift performed over time, and the second tells you what the operator can reach when conditions are good.
Be careful with very short shifts. A shift of one hour has a rate that depends a lot on a single run or on a single lucky opening. A longer shift gives a more stable picture. If your team uses short shifts, combine several shifts of the same operator on the same band before you draw conclusions.
Compare like with like
The most common mistake is to compare the rate of one operator on 20 metres in the daylight with the rate of another operator on 80 metres at night. The bands and the hours are different, and so is the potential for QSOs. A fair comparison puts two operators on the same band at similar hours, or compares each operator with the average rate of the station on that band in that period. If you have a year-on-year log, you can compare each operator with his own earlier results on the same band and hour, as described in year-on-year comparison of the same contest.
The same applies to run and search and pounce. An operator who spends a shift hunting multipliers will have a lower rate and a higher multiplier count. The article on run versus search and pounce shows how the two modes look in the numbers. Look at the mix of the two, and do not judge the shift by the rate alone.
Multipliers and quality
Rate is only one half of the score. A shift that found five new multipliers in a slow hour may have contributed more than a shift that logged a hundred extra QSOs on a band with no new multipliers. Count the new multipliers per shift, and count how many were worked for the first time on each band. The article on multipliers per hour explains how to read them.
Quality includes errors. If you have a list of QSOs that needed correction after the contest, count them by shift. A shift with a high rate and many errors is not better than a slower one with few, because each error removes a QSO and sometimes more. The numbers tell you where to put the extra attention, for example a second pair of ears for the hours that show the most mistakes. See also the article on fatigue hours and errors in the statistics.
Using the statistics in Contest Analyzer
Contest Analyzer gives full statistics for the log: rates, QSOs by hour and band, countries, continents, CQ and ITU zones, WPX prefixes, distance, beam heading, breaks and off time, and callsign length and structure. With the hourly view you can match each shift of the schedule to the QSOs in that period, and with the band view you can see which band each shift used. Year-on-year comparison with your own logs lets you compare the same hours across years.
It checks every callsign and every zone against official license databases and several independent reference sources and shows only the few QSOs worth a second look, so the team can find the errors without reading the whole log. You can edit calls, zones, time and frequency in the report, mark QSOs checked in your own audio recording and download a corrected Cabrillo. It works with Cabrillo from N1MM Logger+, DXLog and Win-Test, in 25 languages. The contests page lists the 22 supported contests.
Sharing the results with the team
When you present the numbers, start with what the team did well. Show the best hours, the best bands and the multipliers that were found. Then show the weak hours and ask what happened. Often the answer is simple: the band was closed, a computer was down, or two operators were tired at the same time. A team that discusses numbers in a friendly way learns more than a team that hides them.
Agree on a few simple targets for the next time. For example, a minimum rate for the main run hours, a plan for a multiplier search at fixed times and a rule for who checks the log between shifts. Write them in the team notes, together with the schedule, and use them before the next contest. The article on setting realistic contest goals from last year’s statistics describes the approach for a single operator, and it works for a team as well.
Limits of the method
There are things that statistics cannot show. They cannot tell you who helped with the antennas, who kept the station running at four in the morning or who made the coffee. They cannot show the effect of the operator on the others: a good operator in the next seat may improve the rate of the whole station. So use the numbers as a tool for planning the schedule and training, and not as a final judgement.
Keep the discussion about the station and the plan. The numbers are there to help the team to win next time, and that is the only reason to collect them.
A simple worksheet
You do not need special software to start. A sheet with one row per shift is enough. For each row write the operator, the start and end time in UTC, the number of QSOs, the average rate, the best hour, the new multipliers found, the number of corrections afterwards and a line of comment about the conditions. Fill it from the statistics of the log and from the notes of the team. After two or three contests the sheet will show you patterns that you cannot see in one weekend: an operator who is always strong at the start of the contest, one who finds more multipliers at night and one who keeps a steady rate through the quiet hours.
Use these patterns to plan the schedule for the next time. Place the operator with the best peak rate at the hours with the best potential, and place the operator who is good at multipliers in the hours where multipliers are most likely. Keep the plan flexible, because propagation may change the picture, but start with what the numbers say. A written plan, even a simple one, gives the team something to improve.
Finally, remember to record the conditions together with the numbers. A note such as “a thunderstorm nearby”, “a power cut for ten minutes” or “a new antenna on 15 metres” explains a lot when you read the sheet a year later.
Related reading
The bottom line
Split the log by shift, compare similar bands and hours, and read rate together with multipliers and errors. Use the numbers to plan, not to blame.
FAQ
Do I need an operator field in the log?
It helps, but a written shift schedule in UTC can do the same job.
Is a higher rate always better?
No. Multipliers and error count matter too. Read all three together.
How long should a shift be for fair statistics?
Longer shifts give a steadier picture. Combine short shifts of the same operator before comparing.
Can I compare operators on different bands?
Only with care. Compare each one with the station average on that band and hour.
Does the tool know who was at the key?
It works from the log. You match the shifts from your own schedule.