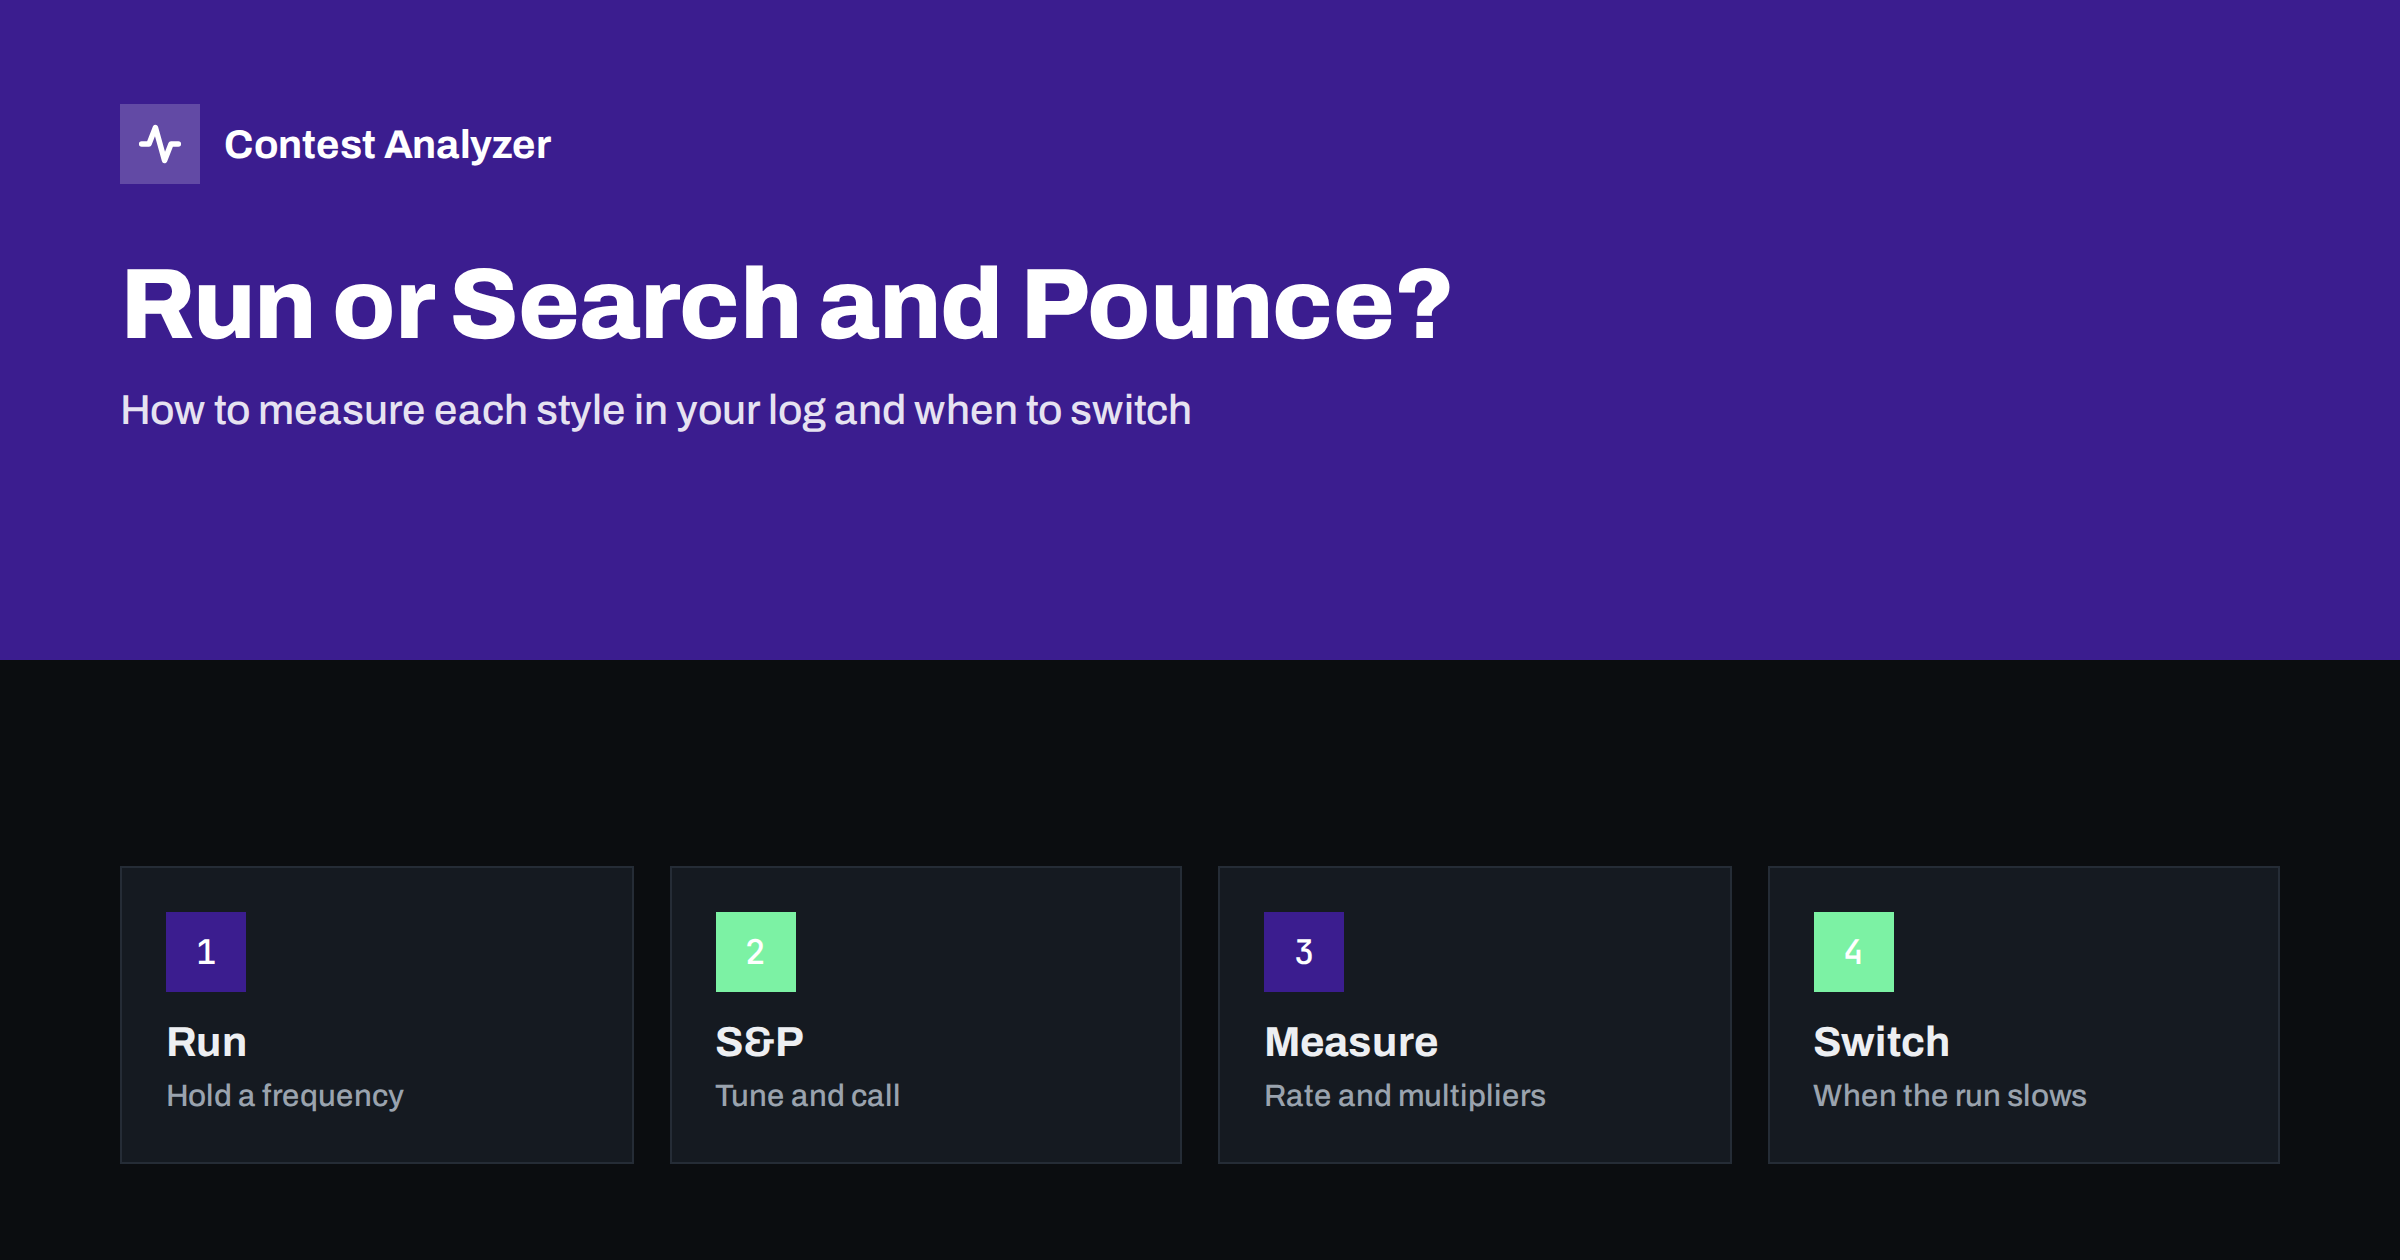
Short answer: Running means you hold a frequency and let stations come to you; search and pounce (S&P) means you tune the band and call others. Running usually gives the higher rate, S&P usually gives the multipliers. A Cabrillo file does not label either style, but you can estimate them from the frequency column and the timing between QSOs, then compare rates and multiplier yield hour by hour. The numbers show when a run has stopped paying and when it is time to tune up the band.
Two different games inside one contest
Almost every serious contester switches between running and S&P many times during a contest, and it helps to treat them as separate activities with different goals.
- Running is a rate game. You call CQ on a clear frequency, the pile-up builds, and each QSO takes a few seconds. The weak point is that you work whoever finds you, so new multipliers arrive only by chance.
- Search and pounce is a multiplier game. You tune across the band, listen to stations calling CQ or working others, and call those you need. Each QSO takes longer because of tuning and waiting, but you choose the contact, so you can go straight for the zone or country you lack.
Neither is better in the abstract. Which is better at a given moment depends on propagation, your signal, the band, the time and how many multipliers you still need. That is why measuring both in your own log is more useful than any general rule.
What the log can and cannot tell you
Many contest loggers record whether a QSO was made while running or in S&P, and their own statistics windows can show it. However, the Cabrillo file that you send to the sponsor does not carry this flag. Its QSO lines contain frequency, mode, date, time, callsigns and the exchange, nothing about how you got the contact. If you only have the Cabrillo file, you have to estimate.
The estimate works because running and S&P leave different traces:
- Frequency. During a run, consecutive QSOs share the same frequency or sit within a few hundred hertz of each other. During S&P, consecutive QSOs are on different frequencies, often several kilohertz apart.
- Time between QSOs. A run produces short, regular intervals. S&P produces longer and more uneven intervals, with occasional long gaps when you search without success.
- Band changes. A new band usually begins with S&P, since you have no frequency yet, and often turns into a run once you find a spot.
These patterns are good enough for a rough division: a stretch of QSOs on one frequency counts as a run, scattered QSOs count as S&P. State your rule clearly, for instance “five or more consecutive QSOs on the same frequency, within 200 Hz, count as running”, and apply it the same way every year. The exact rule matters less than keeping it stable, because you are interested in the comparison between years and between hours. If you recorded your style in the logger, use that instead and treat the frequency method as a check.
What to measure
Once you have split the QSOs into the two groups, a small number of figures answers most questions.
| Figure | Run | S&P |
|---|---|---|
| QSOs per hour of that style | The rate while running | The rate while pouncing |
| Share of total QSOs | How much of your result is running | How much is S&P |
| Hours spent | Time on a run frequency | Time spent tuning |
| New multipliers per hour | Usually low | Usually higher |
| Dips in rate | When the run died | When nothing new was found |
Do not compare the raw rates alone. A rate of 60 an hour in S&P that brings six new multipliers can be worth more than 120 an hour in a run that brings none. This is the same logic as in our article on contest rates: rate is a means, and the multiplier factor in the score multiplies everything you earn.
Reading the result
With the figures in hand, a handful of patterns appear again and again.
- Running rate far above S&P rate, but few hours running. You may have given up good run frequencies too early. Check which bands produced your longest runs and whether you stayed there long enough.
- Long runs with a falling rate. A run that falls to half its peak rate for an hour or more is a candidate for a switch. The pool of stations that can hear you is shrinking.
- A lot of S&P with few multipliers. Tuning with no result is the most expensive thing in a contest. If this happens, you are probably tuning at the wrong time of day for that band, or you have already worked most of what is reachable.
- Almost no S&P at all. A pure run can build a high QSO count, but you will miss multipliers on bands where you are not the loudest. Check the multipliers per band against previous years.
- Equal run and S&P rates. If the two are close, your S&P technique is strong, or your run frequencies are weak. Both are worth knowing.
When to switch: practical rules of thumb
No rule fits every contest, but a few ideas hold in most of them.
- Switch from running to S&P when the run rate has dropped clearly below your recent average, when you notice the same stations calling again with fewer new ones, or when the multiplier counter shows needed zones or countries that you could pick up quickly.
- Switch from S&P to running when you have found a frequency that is free and your signal is strong on the band, when the S&P search has produced several empty minutes, or when the band is clearly in its best period.
- Take a short S&P pass during a good run only if the gain is clear. Leaving a profitable frequency has a cost: someone else may take it, and you have to find a new one.
- Use the clock. Many bands have predictable openings. A planned S&P pass at the moment when a new region comes in usually brings more multipliers than the same pass at a random time.
The point of measuring your own log is that these thresholds are personal. They depend on your antennas, your power and your skill, so use your own data to set them. If you want a deeper look at timing and bands, see our article on comparing your results year on year.
A simple example with made-up numbers
The figures below are invented only to show the method; they are not from a real log. Suppose that on one band you spent four hours. Using your rule, you classify two hours as running with 90 QSOs per hour and two hours as S&P with 40 QSOs per hour. The band total is 260 QSOs, of which 180 came from running. Now add the multipliers: the running hours brought two new zones in total, while the S&P hours brought seven new zones and countries.
The conclusion is not “running is better” or “S&P is better”. It is that this band deserved a first S&P pass to collect the multipliers, followed by a long run for the points, and that the order might be improved next year. Write one such sentence for each band, and you have a plan that comes straight from your data. Repeat the exercise after the next contest and see whether the plan paid off.
Where Contest Analyzer helps
Contest Analyzer does the arithmetic for you. Upload a Cabrillo file from N1MM Logger+, DXLog or Win-Test and the report shows full statistics: rates, QSOs by hour and band, countries, continents, CQ and ITU zones, WPX prefixes, distance, beam heading, breaks and off time, callsign length and structure. With the hour-and-band tables, next to the countries and zones lists, you can see where the rate fell and which bands carried the multipliers, which is the raw material for the comparison above. The year-on-year view puts the same numbers for your earlier logs side by side. For a split by running and S&P, use your logger’s own flag or the frequency method above.
At the same time, the report checks every callsign and every zone against official license databases and several independent reference sources and shows only the few QSOs worth a second look. You can edit callsigns and zones in the report and download a corrected Cabrillo. Serial numbers are not checked, and dupes are not errors, which matters here: a dupe still takes time, so keep it in your own rate analysis even if it scores nothing. See the list of contests for the 22 supported events.
Related reading
The bottom line
Running wins rate and S&P wins multipliers, and a good contest uses both. Measure each in your own log with a clear and stable rule, look at multipliers per hour as well as QSOs per hour, and let the numbers tell you when a run has outlived its usefulness. Then plan the next contest around the hours where the numbers say you gained most.
FAQ
Does the Cabrillo file show whether a QSO was a run or S&P?
No. The QSO line has frequency, mode, time, callsigns and exchange. You can estimate the style from the frequency and timing, or use the flag your logger recorded.
Is running always better than search and pounce?
No. Running usually gives the higher rate, but S&P brings multipliers, which multiply your whole score. The best mix depends on conditions and on what you still need.
How many hours should I run?
There is no fixed share. Compare your own results from earlier years and see which mix of running and S&P produced the best score for your station.
How do I define a run from the frequency column?
Pick a rule, for example several consecutive QSOs within a narrow frequency range, and use it every time. Consistency matters more than the exact numbers.
Are dupes part of my rate?
They take time like any other QSO, so they count in a raw rate analysis even though they give no points. Contest Analyzer does not treat dupes as errors.