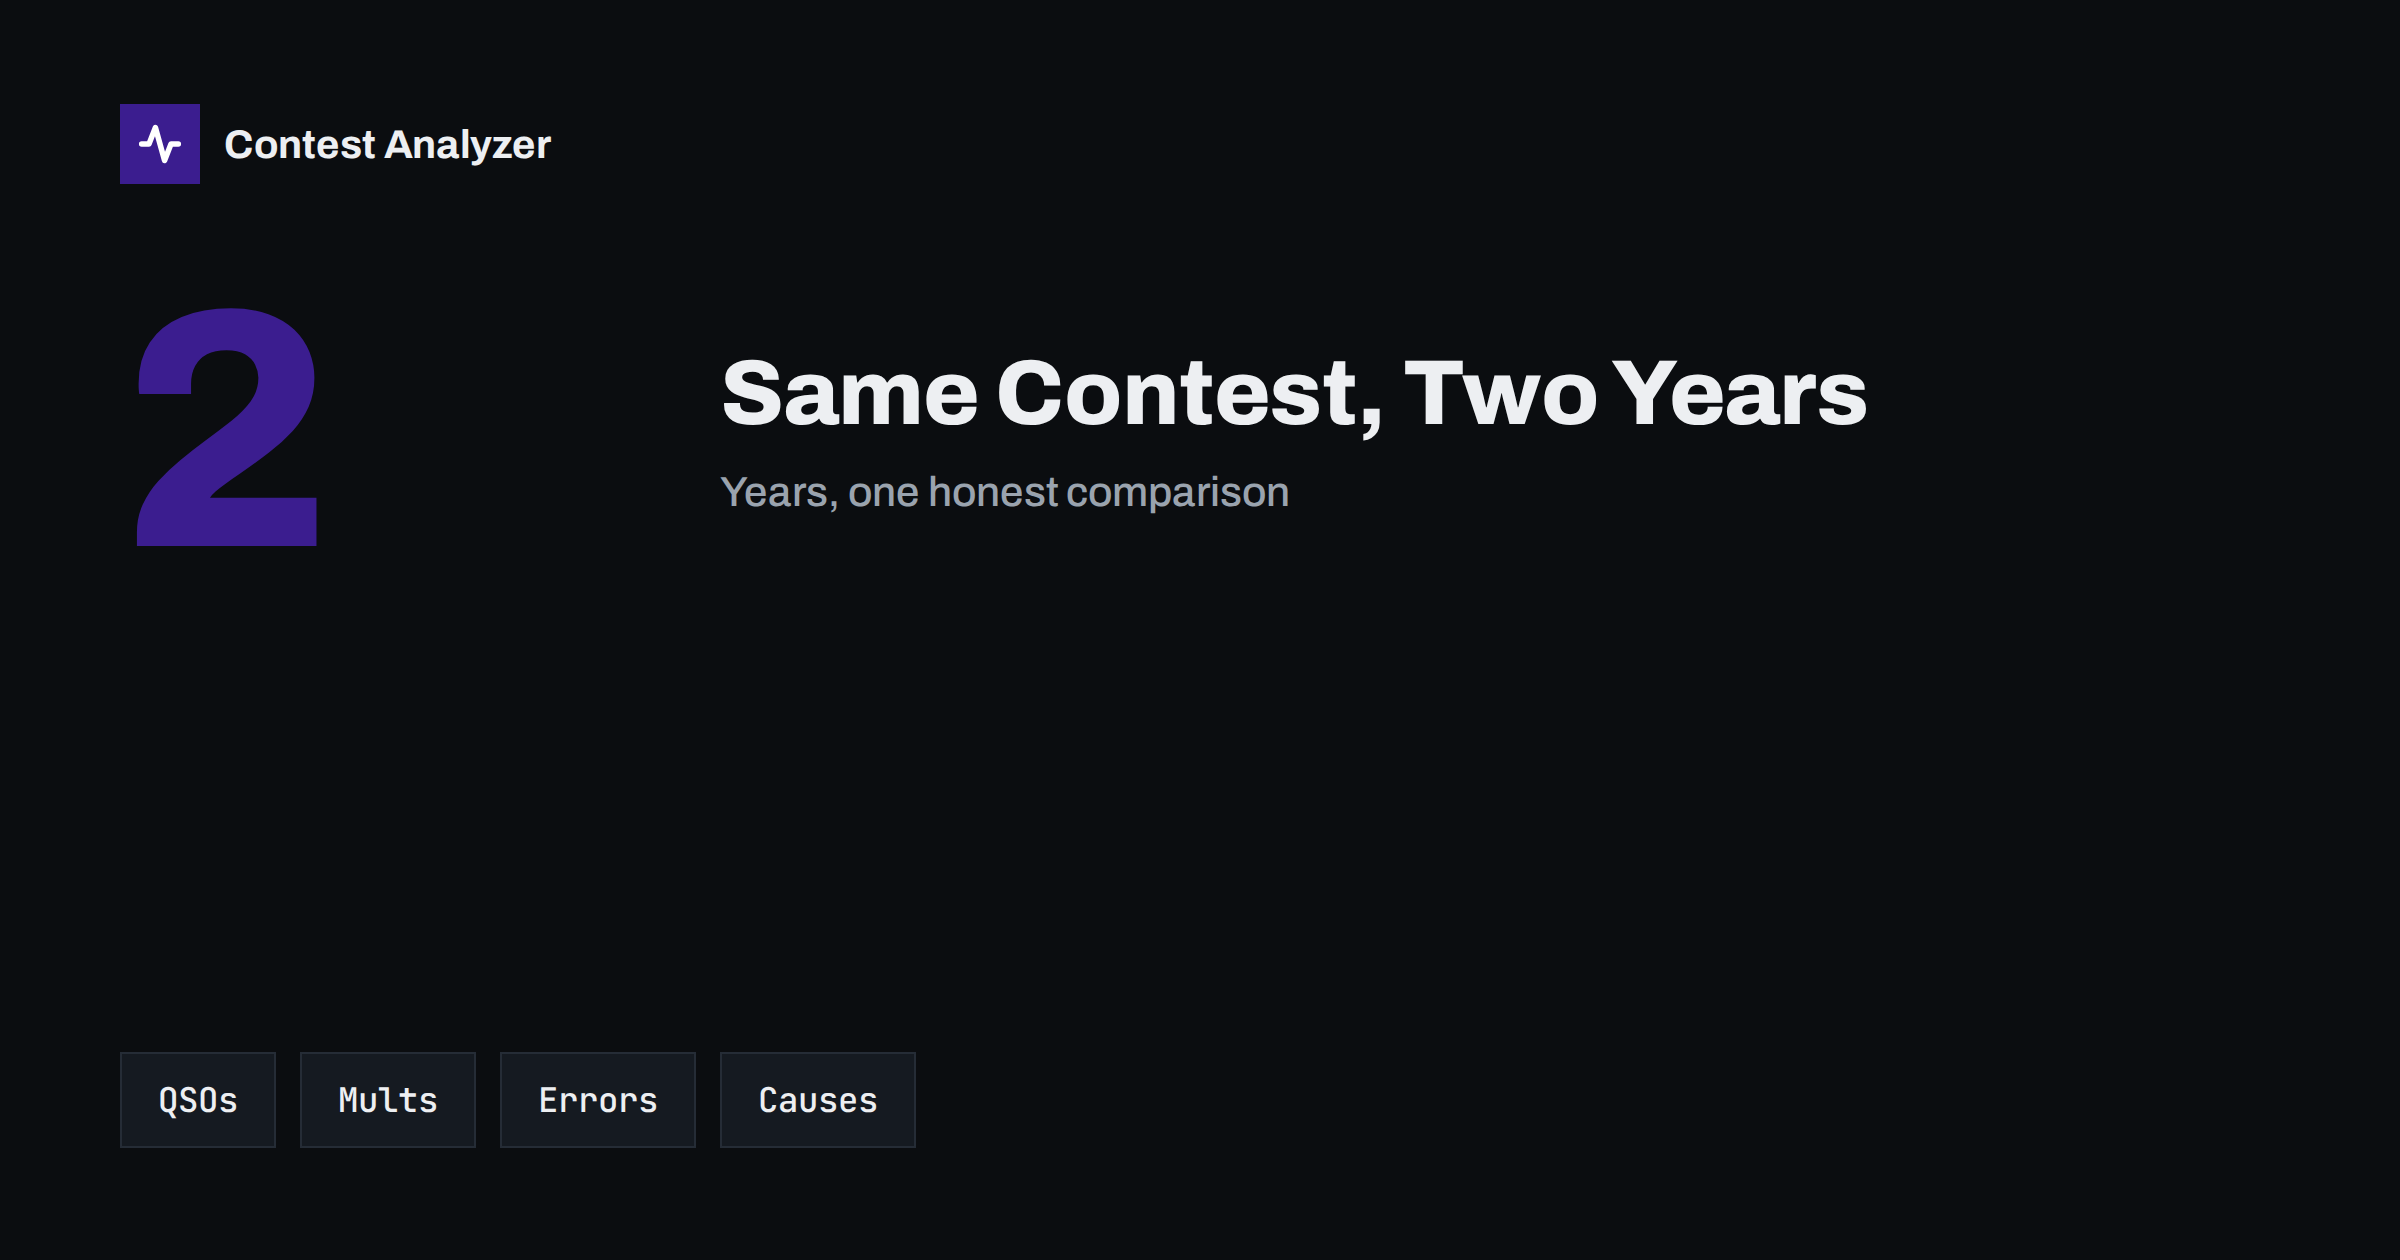
Short answer: To compare the same contest in two years, put the same numbers side by side: QSOs, multipliers, rate by hour, QSOs by band, errors and corrections, operating time. Then ask what caused each difference: your station, your operating, the propagation or the rules. Only the first two are under your control, so try to separate them from the other two before you draw a conclusion.
Why the same contest is the best comparison
A comparison between two different contests is of little use, because the rules, the exchange, the scoring and the participants differ. The same contest in two years is much better, since the framework is nearly the same: the same duration, the same bands, the same type of exchange and a similar crowd. When the framework is the same, a change in your numbers has a good chance of having a meaning. The article on comparing contest results year on year introduces the idea, and the article on realistic goals shows how to use it for planning. This article looks at how to read the differences and what to avoid.
Put the right numbers side by side
Take the two logs and make a short table with the numbers for each year. A useful list is the following.
- Total QSOs and operating time. The time matters, since a log with more QSOs may simply have been made in more hours.
- Rate. The average rate per operating hour and the best hour. The article on contest rates describes how to measure it.
- Multipliers. The number of zones and countries, in total and by band, and the time at which they came.
- QSOs by band and by hour. The pattern of use of the bands through the contest.
- Continents and distance. Where the QSOs came from and how far.
- Errors. The number of corrections you made in the review and the number of doubtful QSOs.
- Breaks and off time. How the time was divided between operating and rest.
- Claimed and final score. If you have the final result, the difference between the two.
Contest Analyzer produces most of these numbers from your Cabrillo files. The report gives full statistics, with rates, QSOs by hour and band, countries, continents, CQ and ITU zones, WPX prefixes, distance, beam heading, breaks and off time, and callsign length and structure, and it allows comparison with your own logs from earlier years. It also checks every callsign and every zone against official license databases and several independent reference sources and shows only the few QSOs worth a second look. You can edit calls or zones in the report and download a corrected Cabrillo. It works with Cabrillo from N1MM Logger+, DXLog and Win-Test and supports 22 contests; see the contests page.
The four causes of a difference
When a number is different, think of four possible causes, and try to separate them.
- Your station. A new antenna, a change of power, a new radio, a problem that was repaired or a problem that appeared. This is the cause that you decided.
- Your operating. A different plan, a different amount of time on the air, a different category, different breaks, a different style of running or searching. This is also in your hands.
- The propagation. The solar flux, the geomagnetic activity and the seasonal conditions differ between years, and they have a large influence on the rate and the multipliers. The article on solar flux and the K index explains how to take this into account.
- The rules and the participation. A rule change, a change in the number of active stations, a rule about categories or scoring that was different. Read the rules of both years before you decide.
The mistake that most operators make is to give the whole difference to the first two causes, when a large part came from the third. A good result in a year with good propagation does not prove that the station is better, and a poor result in a bad year does not prove that it is worse.
Control for the conditions
Because you cannot repeat the propagation, look for numbers that are less sensitive to it. One is the share of QSOs by band: if the bands that were open were different in the two years, the share changes for that reason. Another is the rate in the hours when you were on the same band in both years. A third is the performance in comparison with other stations of the same class, if the results are published. If your result went up by a certain percentage and the stations of your class also went up, the improvement is partly due to the conditions. If your station went up while the others stayed the same, it is more likely that your changes worked.
Also keep a record of the changes. The best help for this is the station notebook, in which you write each change in the station and in the plan. When the numbers of two years are in front of you, the notebook says which changes happened between them.
Compare the errors honestly
A comparison of the number of QSOs without the errors tells only half of the story. A log with more QSOs and a higher percentage of busted calls may give a lower final score. Compare the number of corrections and the number of doubtful QSOs in each year, and look at when they happened. Did the errors fall after you changed your habits, such as asking for fills or taking breaks? Did they rise when you tried a higher speed? The article on claimed and final scores explains why the gap exists, and the one on the post-contest review routine shows how to count the corrections.
When you compare the errors, use the same method in both years. If you used a tool in one year and no tool in the other, the number of errors found is not comparable. Use the same checks and the same threshold for a correction.
Read the curve, not only the total
Compare the shape of the contest as well as the total. Where were the peaks in the rate? When did the multipliers come? How long was the longest break and when did it fall? In the better year, did you get the same number of QSOs in less time, or more in the same time? These questions need the hourly data, and the article on hour-by-hour analysis explains the sheet view. A comparison of two hourly curves on one chart often shows in a minute what a table does not: the hours in which one year was better.
A short worked reading
Imagine two years of the same contest. In the second year you made more QSOs, but the multipliers are the same, and the corrections rose. The reading may be that you ran more and searched less, that the rate was good on the bands that were open, and that the speed was higher than your accuracy could support. Another reading: the propagation gave a long opening on one band, so the QSOs came easily, and the multipliers did not change since the pool was already used. To decide between the readings, you look at the hourly data, the bands, and the hours of the corrections, and you check the solar conditions of the two years. The numbers alone do not give the answer, but they tell you where to look, and each question that they raise is a better question than the one you started with.
Avoid the temptation to find one reason for everything. A real contest has many small causes, and a comparison that names three of them with some evidence is more useful than one that names a single cause with confidence.
From comparison to a plan
The purpose of the comparison is the next contest. After you have compared the two years, write the three most important findings and one action for each. For example: the rate on 40 m in the second night was lower in the second year, and the action is to check the antenna and the plan for that period. Or: the number of corrections rose in the last six hours, and the action is to plan a rest earlier. Keep the plan short, and put it in the notebook. When the next contest comes, the comparison starts again, with one more year of data.
Related reading
- Compare contest results year on year
- Setting realistic contest goals from last year’s statistics
- Judging an antenna change with your contest statistics
The bottom line
A year-on-year comparison is useful when it separates the causes. Put the same numbers side by side, ask what changed in the station, in the operating, in the propagation and in the rules, compare errors as well as QSOs, and finish with a short plan for the next contest.
FAQ
Which numbers are the most important to compare?
QSOs and operating time, rate, multipliers, QSOs by band and hour, and the number of corrections. Together they give a fair picture.
How do I take the propagation into account?
Compare the share of QSOs by band and the rate in the same hours, and read the solar and geomagnetic conditions of both years.
Can I compare years if the rules changed?
With care. Read the rules of both years and compare the numbers that did not change, such as the rate and the QSOs by band.
Why compare errors?
Because more QSOs with more errors may give a lower final score than fewer QSOs with fewer errors.
What do I do with the result?
Write three findings and one action for each, and put them in your notebook for the next contest.