Short answer: A year after a contest, nobody remembers exactly what the station looked like. A station notebook is a short, dated record of antennas, amplifier, cables, software, settings and operators, with a few words about conditions. When your statistics change from one year to the next, the notebook shows whether the cause was your station, your operating or the weekend itself. Three lines per change are enough, if you write them every time.
The problem the notebook solves
Contest statistics are full of changes. The rate is higher or lower, the continents shift, the best band moves and the average distance changes. After you have a few years of data, you can ask why. Was it propagation? A new antenna? A different operator? A change in the way you ran or searched? Without a record, the answer is a guess, and a confident guess is often wrong. People tend to credit the last thing they remember, such as the new beam, and to forget the less visible things, such as a change in the logger settings or a smaller number of hours at the desk.
A notebook turns memories into facts. When you read the statistics in the review and see an unexpected drop in the QSOs on 40 metres, you can look at the notebook and find that the antenna on that band was down for the first night, or that you changed the cable. The explanation may be simple, but without the note you would not have it.
What to write down
The notebook does not need to be long or formal. A text file, a spreadsheet or a paper notebook all work, provided that it is kept in one place and that you add to it regularly. These are the main items:
- Date. Every entry has a date. This is what links the note to the contest.
- Antennas. Type, height, direction and any change. Include the antennas for receiving, if you use separate ones.
- Power and amplifier. The output you used and any change of equipment.
- Radio and filters. The transceiver, the filters and the main settings that you adjusted.
- Cables and connectors. A new feed line or a repaired connector can change the results of an antenna.
- Software. The logger and its version, the country file, any plug-ins and the settings that you changed, for example the macros or the exchange.
- Operators. Who operated, in which hours, and how many people were at the station.
- Conditions. A few words about noise, weather and propagation during the contest.
- Problems. What failed, when and how long it took to repair.
The format can be very simple. A line such as “20 m beam raised by 3 m, new feed line, tested before the contest” is already useful.
Three lines per change
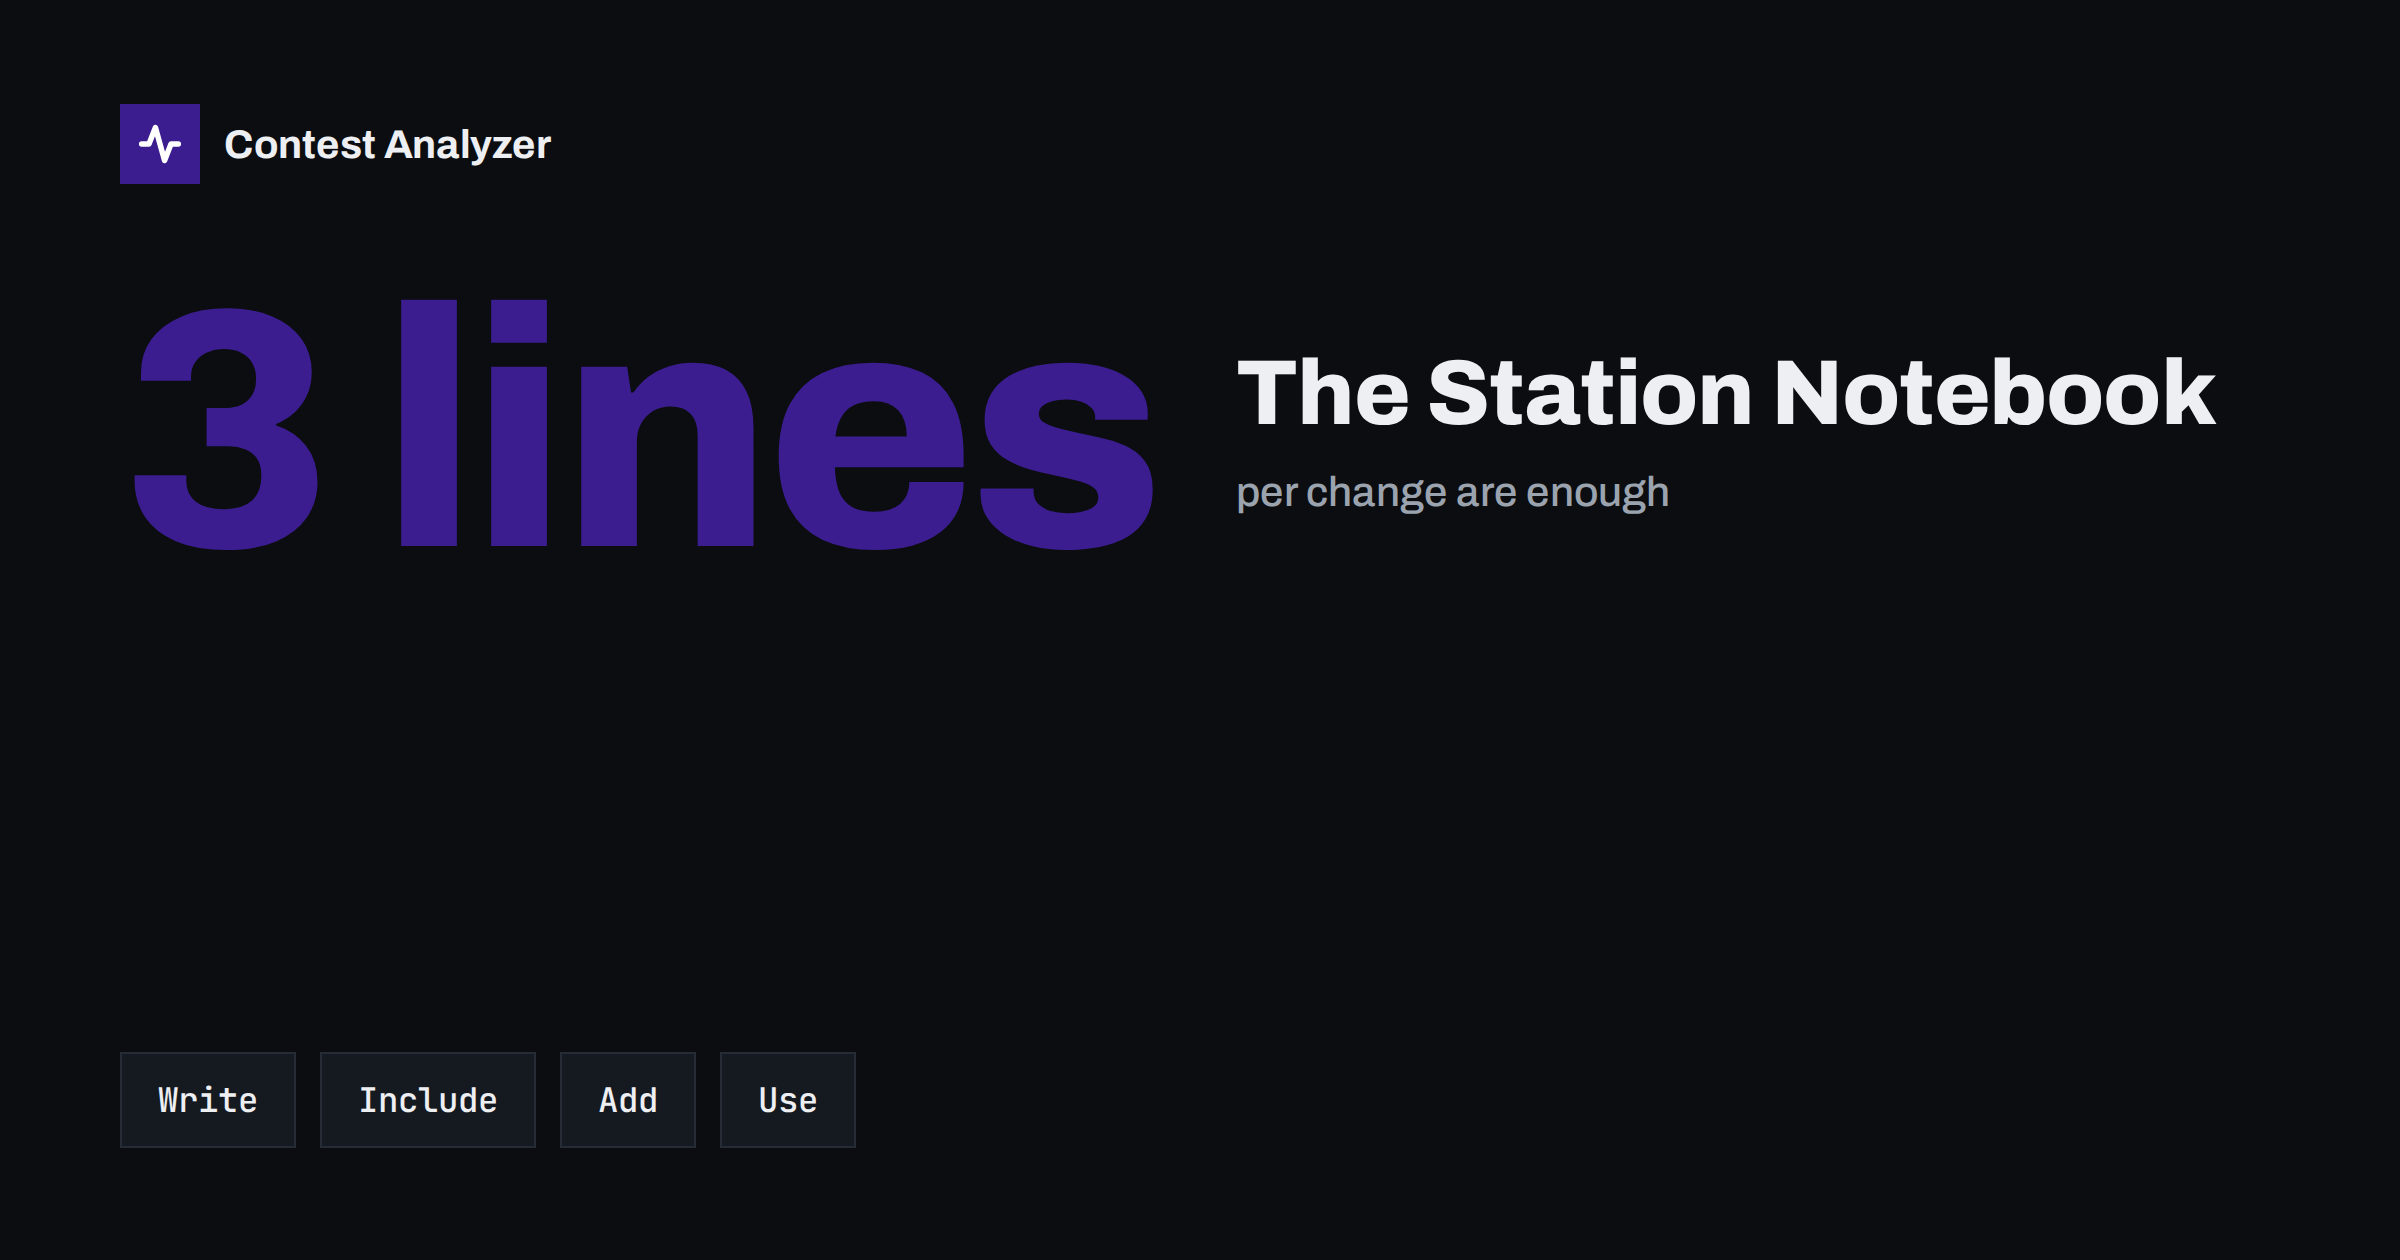
The main reason why many notebooks are abandoned is that they take too much time. To prevent this, keep each entry short. Three lines are enough: what you changed, why you changed it and what you expect to see in the next contest. The third line is the most useful. It turns the note into a small hypothesis that you can check against the statistics. For example: “Moved the low-band receive antenna away from the house. Expect lower noise at night. Check QSOs on 80 and 160 m after midnight.” After the contest, you look at the numbers and write the result next to the note.
The expectation also protects you from fooling yourself. If you write what you expect before the contest, you cannot easily say afterwards that you expected something else.
Link the notebook to the statistics
The notebook becomes most useful when it is read together with the numbers of the contest. After each contest, make a short summary of the main figures, such as the number of QSOs, the multipliers, the best rate and the hours of operation, and put it beside the notes about the station. This is the record that lets you compare one year with another; the article on comparing contest results between years describes the figures to keep, and judging an antenna change with your contest statistics shows how to use them for a specific question.
The figures themselves come from a clean log. Contest Analyzer checks every callsign and every zone against official license databases and several independent reference sources and shows only the few QSOs worth a second look. After the review, it gives full statistics, with rates, QSOs by hour and band, countries, continents, CQ and ITU zones, WPX prefixes, distance, beam heading, breaks and off time and callsign length and structure. You can edit calls or zones in the report, download a corrected Cabrillo and compare with your own logs from earlier years. It works with Cabrillo from N1MM Logger+, DXLog and Win-Test and supports 22 contests, which the contests page lists. Serial numbers are not checked and dupes are not errors. Copy the main figures into the notebook, with the date, and you have the pair that makes the comparison possible.
Operators and categories
The operator is one of the largest factors in any result, and one of the most commonly forgotten. If two people operate at the same station, or if the operator changes from year to year, the statistics change. Note who was at the keyboard and for how many hours. Note also the category you entered, the rules that applied and any change in the category, for example from unassisted to assisted. The article on assisted and unassisted categories explains why a category can change the results significantly. Without a note, a difference in the numbers may be attributed to the station when it is really a result of the category.
For multi-operator stations, the notebook also helps with the planning of shifts and the settings of the logger. See merging logs from several computers for the technical points that a group of operators should record.
Conditions you cannot control
Propagation, noise and weather are also part of the story. You cannot change them, but you can write them down. A line such as “poor conditions on the high bands, K index high on the second day” helps to explain a low result, and it will help you later, when you compare years. The article on solar flux and contest results gives more about how to think about it. Add also the local factors: a storm that stopped the work for hours, a power cut, a noisy neighbour. They are the sort of events that people forget but that explain a gap in the hourly statistics.
Keep it where you will find it
A notebook that cannot be found is worthless. Keep the file in the same folder as the logs, or in a folder named for the year, and make a backup like any other important file; the article on protecting your log has ideas that apply. If you prefer paper, keep the notebook near the station. Whichever form you choose, review it before each contest. A few minutes with the notes from last year will remind you of the problems you wanted to solve, and of the changes you wanted to test.
A short routine
- Before the contest, write the state of the station: antennas, power, software and the plan for the operators.
- During the contest, note anything that goes wrong, with the time.
- After the contest, add the main figures from the review and your impressions of the conditions.
- Before the next contest, read the notes and decide on the changes, and write the expectations.
The routine takes little time and gives a lot of value. With a few years of notes, you will have an honest record of your own contesting.
Here is how a few pages of notes might look after three years. In the first year: a wire antenna for 40 metres, no amplifier, one operator, the logger on an old laptop. In the second year: a vertical for 80 metres added, a new laptop, the first use of macros for the exchange, an operator who joined for the second night. In the third year: the amplifier added for the first time, a noise problem on the low bands solved by moving the receive antenna. With these notes beside the statistics, a change in the QSOs on the low bands in the third year can be explained at once, and a change in the rate between the first and the second year is no longer a mystery. Without them, you would have only the numbers and a vague feeling that something was different.
The notebook is also a useful help when something goes wrong. If the station behaves strangely before a contest, the list of recent changes is the first place to look: a new cable, a changed setting or an updated programme is often the cause. Many problems that take hours to find become simple when the last change is written down with its date. In this way, the notebook helps with the preparation as well as with the analysis, and it is worth the few minutes that it takes.
Finally, consider keeping a small list of the things that you plan to test in the future. A line such as “try a lower beam heading on 15 m next year” costs nothing to write, and it connects the analysis of one contest with the preparation of the next. When the time comes, you will find the idea in the notebook, along with the numbers from the previous test.
Related reading
- Comparing contest results between years
- Judging an antenna change with your contest statistics
- Setting realistic goals from last year’s statistics
The bottom line
Statistics tell you what happened. A station notebook tells you why. Write down what you change, what you expect and who operated, keep it with your logs, and add the main figures after each contest. In a few years you will be able to explain your numbers, instead of guessing.
FAQ
How detailed should the notebook be?
Short and regular is better than detailed and abandoned. Three lines per change are enough.
Should I write down what I expect?
Yes. It turns the change into a test and helps you to judge the result honestly.
Is a paper notebook as good as a file?
Yes, provided that you keep it in one place and review it before each contest.
What about conditions I cannot control?
Write them down too. They explain many differences between years.
How does the notebook work with Contest Analyzer?
Copy the main figures from the report into the notebook, with the date, and compare them with your notes about the station.