Short answer: The grey line is the band around the Earth where it is dawn or dusk, and on the low bands the signals along it can be unusually strong for a short time. In a contest, this shows up as short peaks of QSOs and new multipliers around your local sunrise and sunset and around sunrise and sunset at the other end of the path. If you can see these peaks in your hourly statistics, you can plan next year’s low-band time much better.
What the grey line is
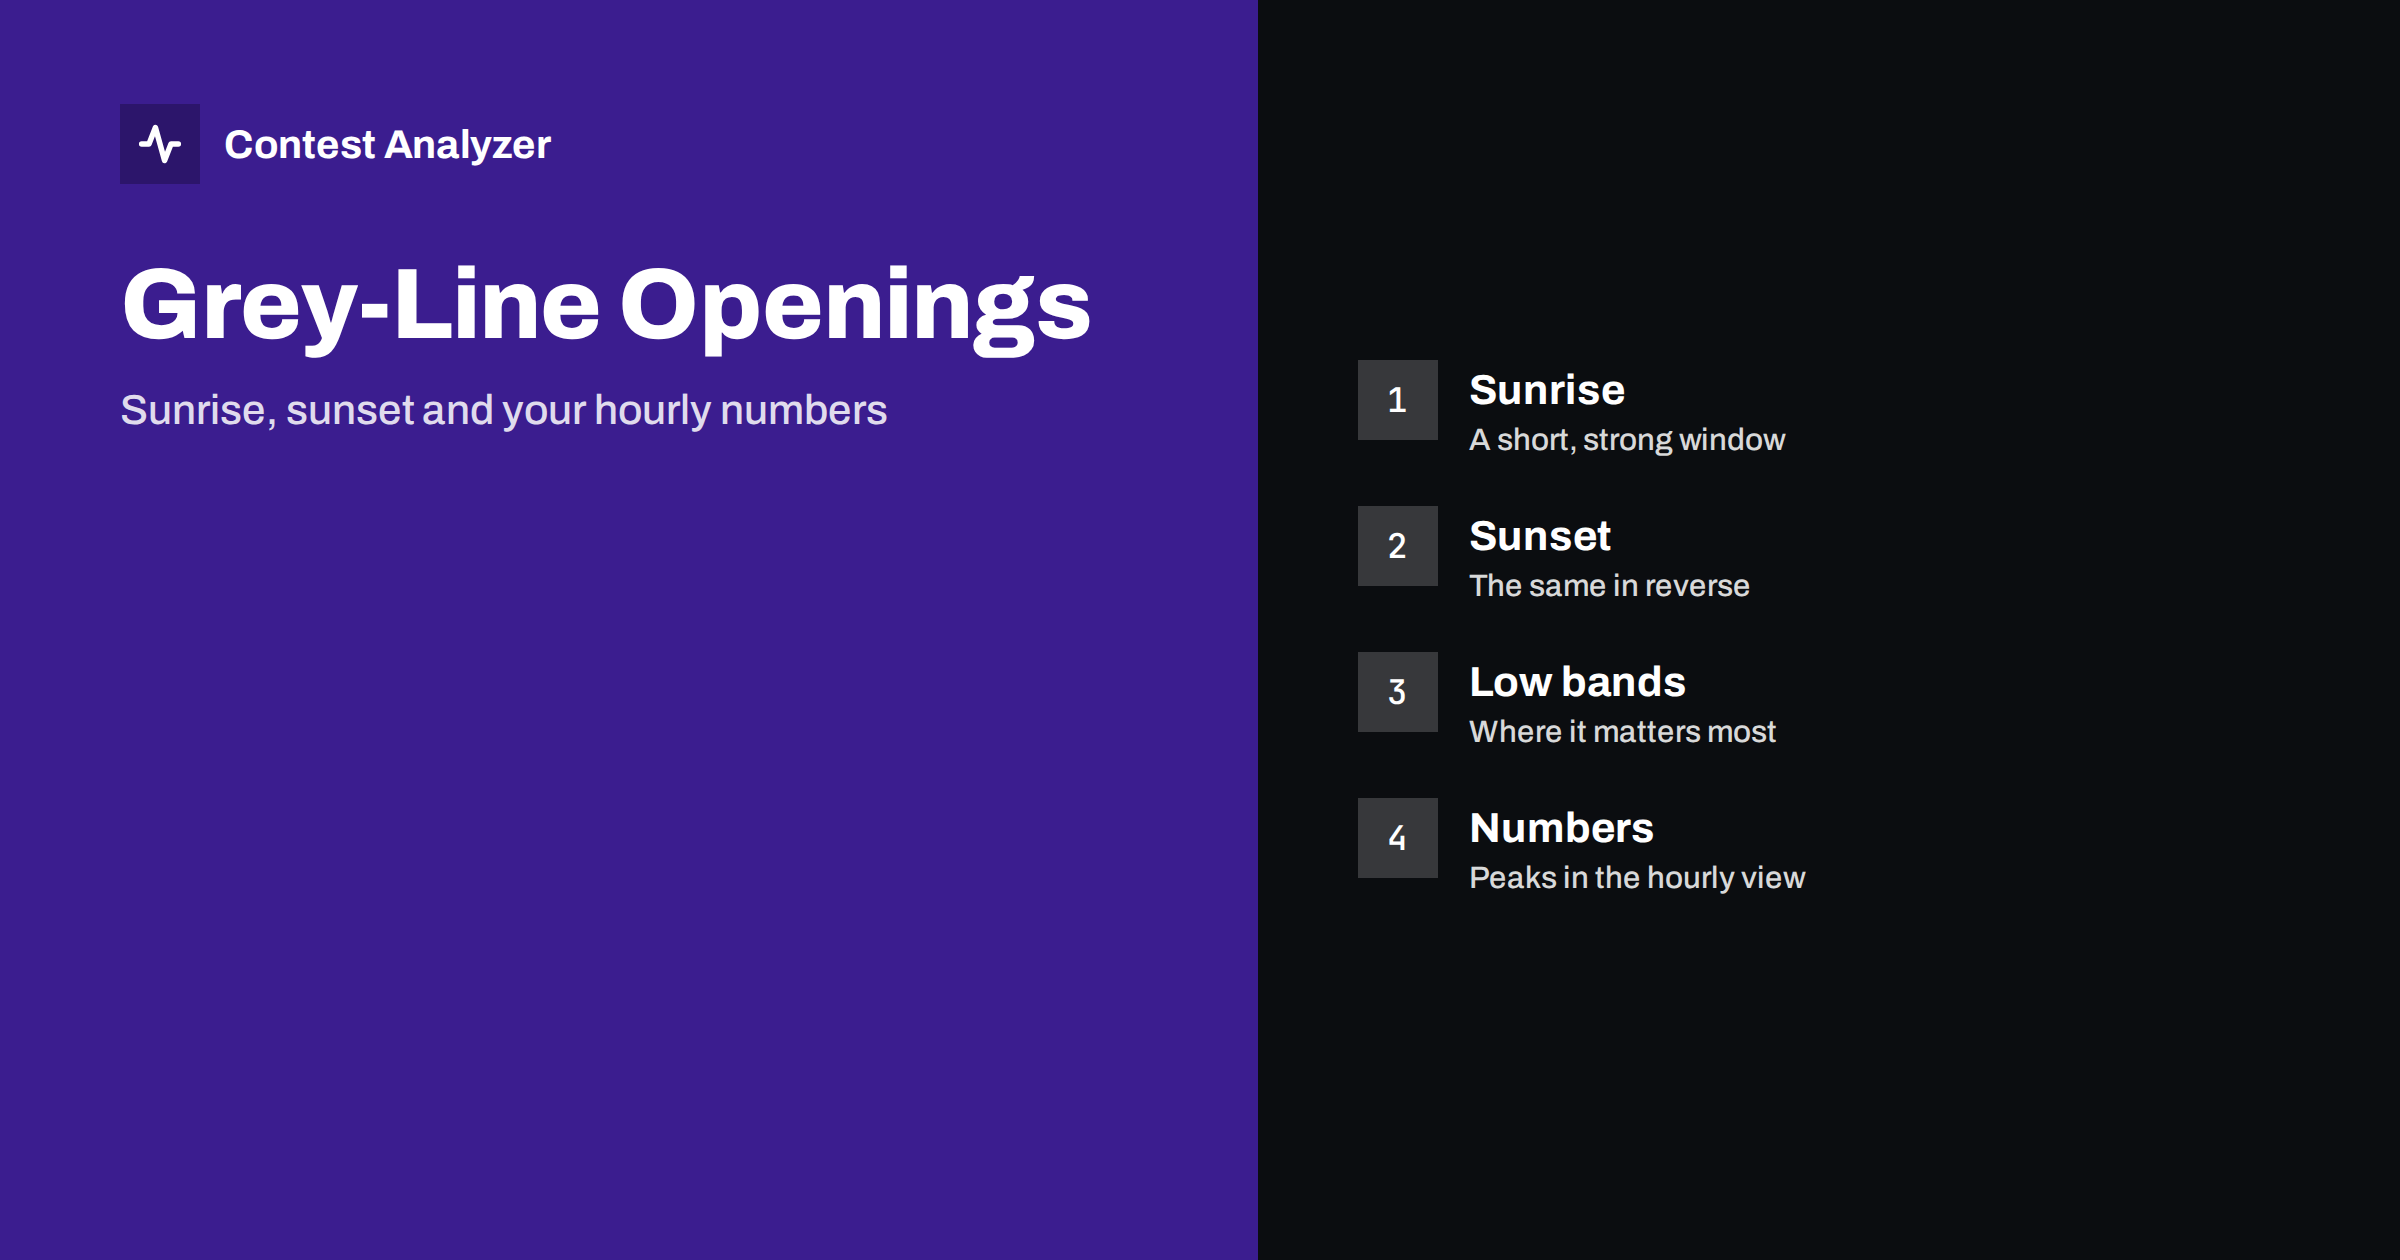
At any moment, half of the Earth is in daylight and half in darkness. The line between them is called the terminator, and the zone close to it, where the sun is just rising or setting, is the grey line. For radio, the interesting part is that along this line the ionosphere changes quickly. The layers that absorb signals in the daytime are weakening or not yet formed, and the layers that reflect signals are still working. On the low bands this can create paths that are not workable at other hours.
The exact behaviour depends on the season, the solar activity and the location. Do not expect the same result in every contest, and do not treat any rule of thumb as a guarantee. The effect is real and well known to low-band contesters, but its strength varies. The article on solar flux and contest results explains why you should be careful when you compare two years.
Why the low bands care most
On 160, 80 and 40 metres, daytime absorption is strong and long-distance signals are weak or absent when the path is in full daylight. At night the absorption goes away and the bands open. The change between the two states is the point where the grey line creates a brief, sharp opening. A station in the dark can hear stations that are just entering darkness, and the opposite for stations in the morning.
That is why topband and 80-metre operators watch the clock around sunrise and sunset. A contest such as the CQ 160-Meter Contest is a good example, because the whole contest is built on this kind of propagation. The same principle applies, with less drama, on 40 metres and on higher bands in other seasons.
Two ends of the path
The grey line matters at both ends of a path. A station at your longitude can be at sunrise when a distant station is at sunset, and for a short time both are in the zone that favours long paths. The practical consequence is that your best low-band window for a given part of the world is not only your own sunrise or sunset, but the time when the path between you and that part of the world touches the terminator at one end or at both ends.
You can check the times with free tools that show the day-night line on a map. Use the date of the contest and your own location and look at where the terminator lies at different UTC hours. Do this before the contest and write down the hours that matter for the areas that are valuable to you, such as new zones or countries. During the contest, you will know when to be on the low bands and when to leave them.
How it shows in your statistics
After the contest, open the view of QSOs by hour and band. A grey-line effect looks like a short peak on a low band around sunrise or sunset, often with a higher number of different countries or zones than the hours around it. If you also look at multipliers per hour, you may see that the new multipliers on that band came mostly in a few windows. This is a sign that the openings did what they should, and that your station was ready to use them.
The picture helps in the other direction as well. If your statistics show nothing at those hours, you may have been off the band, on a different band, or sleeping. Compare the hours with your schedule. The articles on the QSO rate by band and hour heatmap and on continent openings hour by hour describe how to read such a view.
Using distance and beam heading
The grey line also leaves traces in the distance and the direction of your QSOs. During a grey-line opening, the average distance of QSOs on the low band often increases, and the beam heading moves towards the terminator at your location. If you have statistics on distance and on beam heading, compare these hours with the others on the same band. A change in direction at sunrise and sunset is a clue that you were working the grey-line paths.
The articles on beam heading statistics and distance statistics and the longest QSOs show how to use these numbers. They also help you to decide whether a better receiving antenna or a different direction would have brought more.
Planning low-band time
With the data from your own logs, you can plan the low-band time for the next contest. Find the windows where your numbers were best, check the sunrise and sunset times for the next contest date and choose hours that cover those windows. Plan the rest of the time on other bands and plan your rest so that you are awake for the grey-line windows. The article on low-band night strategy goes further in this direction.
Be realistic about effort. The low bands need good antennas and low noise, and the windows are short. If your station is not well suited, you may gain more by spending the time on the bands where you can run. Use the numbers to decide: compare the QSOs and multipliers per hour on the low bands with those on the other bands at the same hours.
Checking the log of the low-band hours
Low-band QSOs are the ones that most often need a second look. Signals are weak, noise is high and the exchange is easy to mishear. After the contest, check the hours with the highest number of low-band QSOs with extra care. Contest Analyzer checks every callsign and every zone against official license databases and several independent reference sources and shows only the few QSOs worth a second look, so you can find the problems without reading each line.
It gives full statistics (rates, QSOs by hour and band, countries, continents, CQ and ITU zones, WPX prefixes, distance, beam heading, breaks and off time, callsign length and structure) and year-on-year comparison with your own logs, which lets you see the grey-line windows in several years side by side. You can edit calls, zones, time and frequency in the report, mark QSOs checked in your own audio recording and download a corrected Cabrillo. It works with Cabrillo from N1MM Logger+, DXLog and Win-Test. See the contests page for the supported contests.
Limits and cautions
A peak in the hourly numbers can have other causes: a pile-up that formed at a certain time, a rare station that appeared, or an operator who came to the seat fresh. Do not assume that every peak is a grey-line effect. Compare several bands and several years, and look for the pattern that returns at the same relation to sunrise and sunset. A pattern that repeats is likely to be real, and a single peak may be luck.
Checking your own station
Grey-line openings are short, and they ask a lot of the station at exactly the time when you may be tired or busy on another band. Prepare for them. Make sure that the low-band antennas and the receiving antennas are working before the contest, that the band-pass filters and the switching are tested and that the logger has the right frequency data for the low bands. A relay that does not switch or a cable that was damaged by the weather will cost you far more in a ten-minute opening than at any other time.
Also prepare the operator. A short rest before the sunrise window, a drink and a snack on the table and a clear idea of what you need on the band will help you to use the window well. In the opening, work fast and keep the exchanges short. When the window closes, note the time in your log notes, because it will help you to read the statistics later. A list of the times when the low bands opened and closed during the contest, written in a few minutes, is one of the most useful notes you can make.
If you are a small station, remember that the grey line helps you as well. A modest antenna can work well during the opening, because the absorption is low and the signals are strong for a short time. Many operators with small stations get their best low-band results at the moment of the grey line, and not in the deep night.
Related reading
The bottom line
Find the sunrise and sunset windows at both ends of the path, be ready on the low bands, and look for short peaks in your hourly numbers afterwards. Use repeating patterns for planning, not single peaks.
FAQ
Is the grey line the same every year?
The geometry follows the calendar, but the strength of the effect depends on the season and solar activity.
Does it work on every band?
It is most visible on the low bands. On higher bands the effect is smaller.
How do I find my grey-line hours?
Use a day-night map for the contest date and note when the terminator touches your location and your target areas.
Can I see it in my statistics?
Often yes, as a short peak in QSOs or multipliers on a low band near sunrise or sunset.
Should I stay on the low bands all night?
Not necessarily. Use your own numbers to decide where your time gives the most.