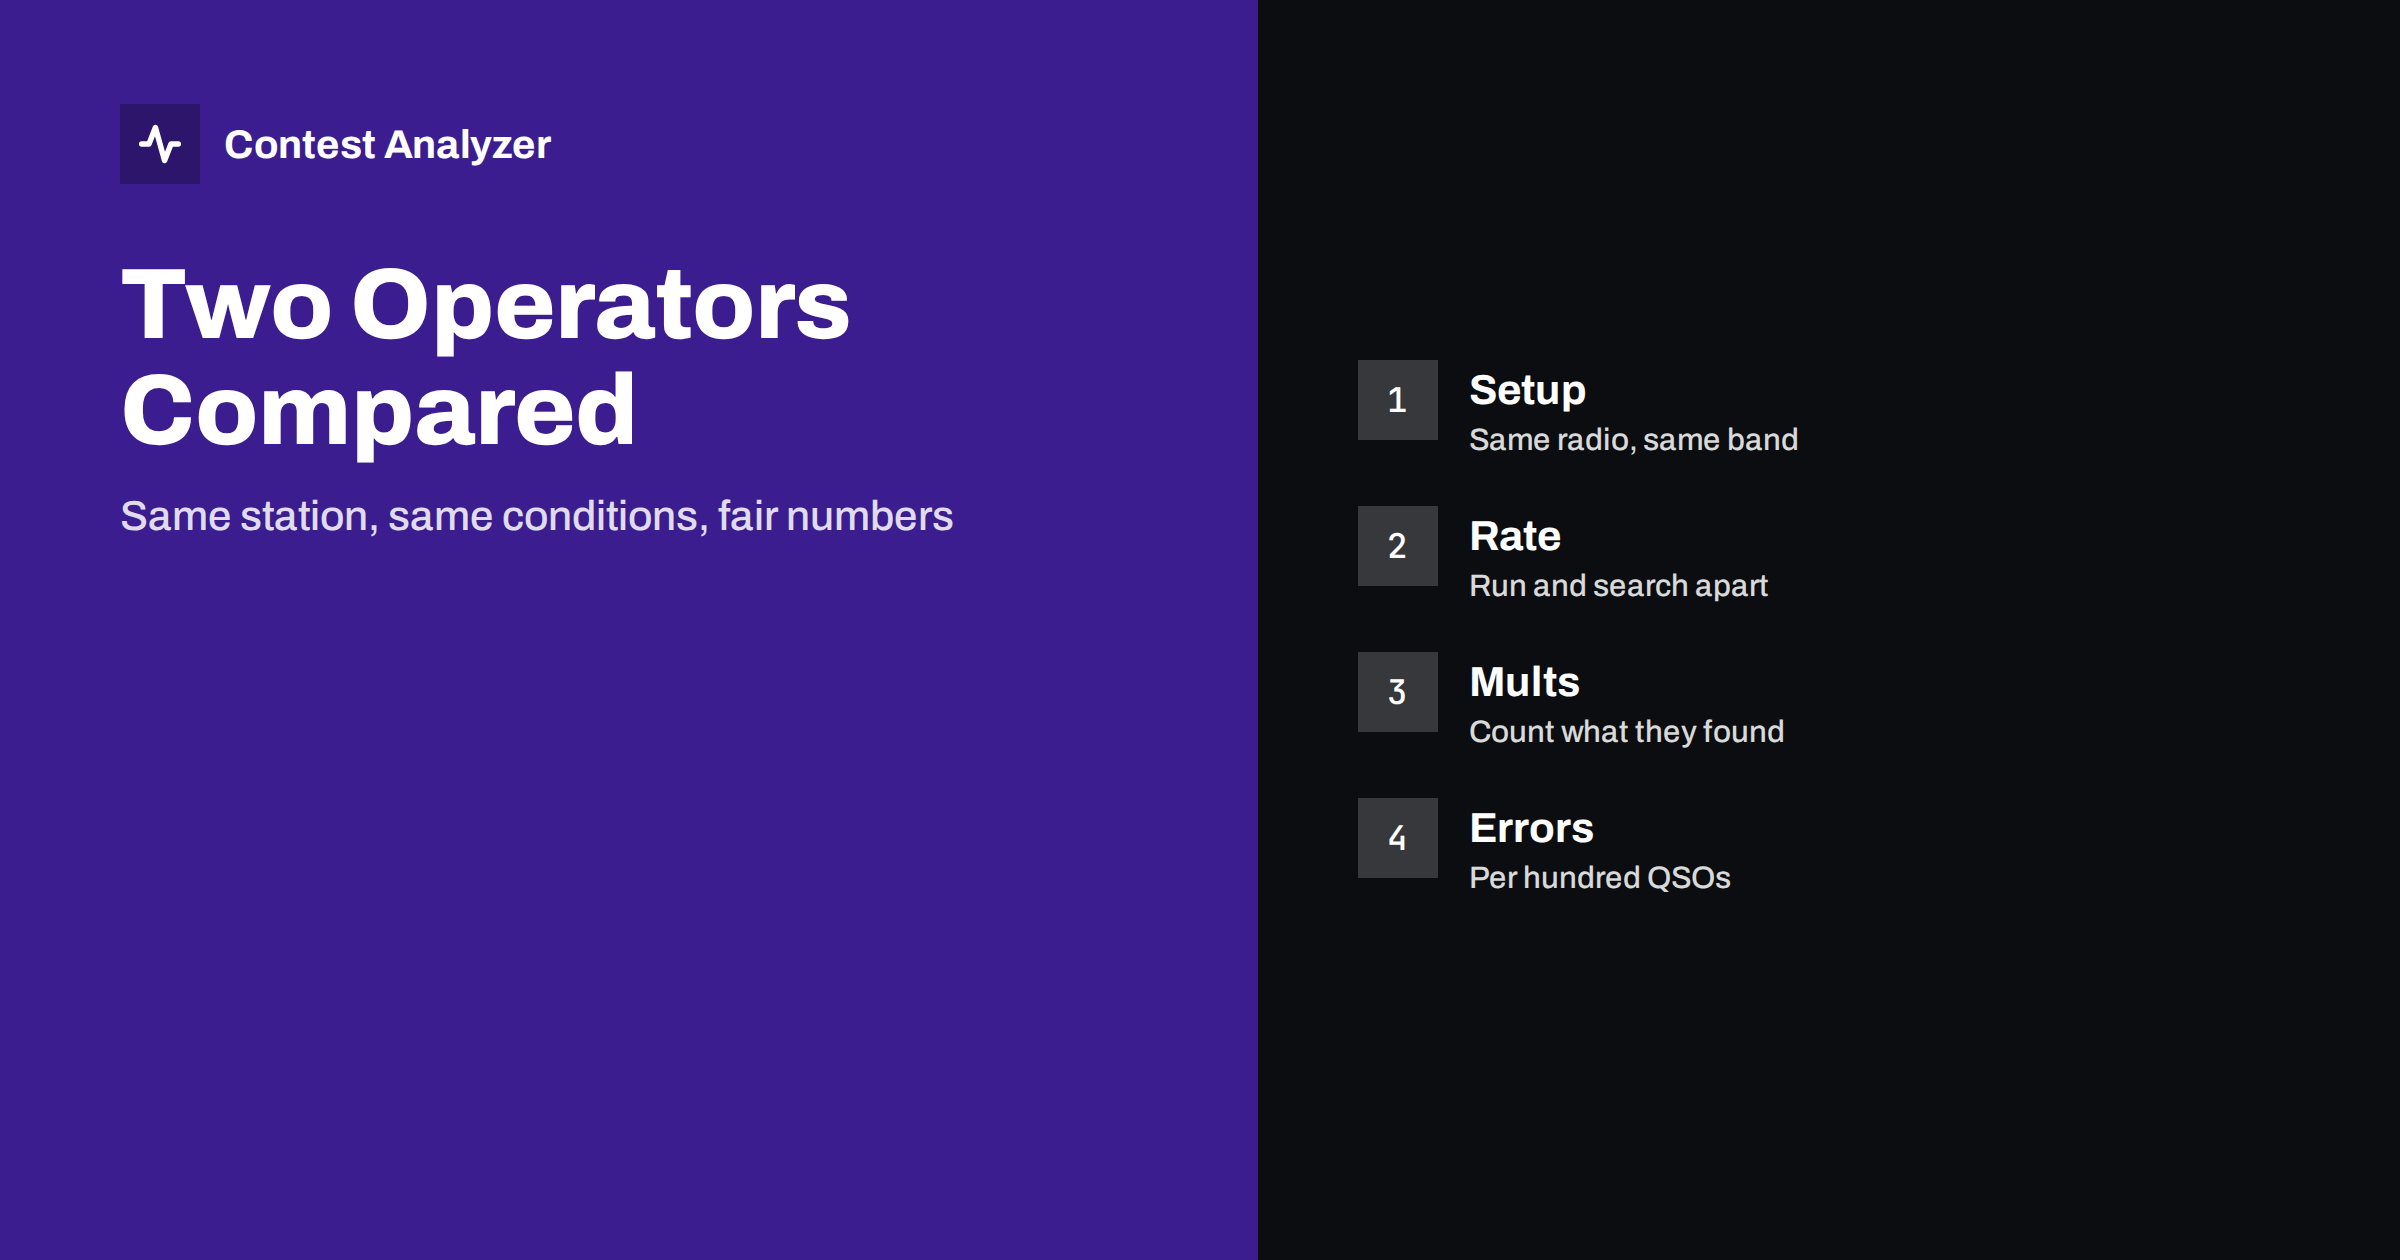
Short answer: If two operators use the same station in turn, for example in a club or in two-person team, statistics can show their strengths. To be fair, compare them on the same bands and at similar hours, separate running from search and pounce, count multipliers found and compare errors per hundred QSOs. The aim is to give each person the job that fits best and to learn from each other, and not to name a winner.
Why compare at all
Two good operators are not necessarily good at the same things. One may be fast on the run frequency, with a clear voice and a steady rhythm. The other may be a sharp listener who finds weak multipliers in the noise. A team that knows this can plan the schedule so that each person works where he is strongest, and each can learn something from the other. A comparison based on numbers is more objective than an impression, and it is easier to talk about.
It is important to say what the comparison is for. It is not a contest between the two, and the numbers can be misleading if used carelessly. Treat the results as questions, such as “why was the rate lower in this period?”, and not as verdicts. This article is about single-operator style work done in turns at one station, in a club or at a shared location, and it is a different case from a large multi-operator entry with several seats at the same time.
Make the conditions the same
The biggest source of unfair comparison is that the two operators do not work in the same conditions. One has the evening, when many stations are active, and the other has the early morning, when few are. One has a band that is open, and the other a band that is closed. Before you compare anything, put the operators in similar situations: the same band, a similar time of day, the same mode and a similar activity level. If the contest does not allow this, use a longer period and several contests, so that the differences average out.
The article on contest rates and QSOs per hour explains how rate depends on the band and the hour, and the one on band strategy hour by hour shows how to read the numbers by band. Use the same approach to select the periods that you compare. A simple method is to take the periods in which each operator worked the same band for at least an hour, and to compare only those.
Run and search and pounce apart
An operator who runs has a different rate profile from one who searches. Running gives a high rate with few new multipliers, and search and pounce gives a lower rate with more multipliers. If one operator mostly runs and the other mostly searches, their overall rates will differ for reasons that have nothing to do with skill. Separate the two modes in the log, using the frequency changes and the series of QSOs as a guide, and compare run with run and search with search.
The article on run versus search and pounce describes how to recognise each in the numbers. If the two operators differ in style, the question is whether the team uses both styles well, not which operator has the better overall rate. Often the best plan is to let the faster runner run the strong bands and to give the multiplier work to the other.
Multipliers and quality of finds
Count the new multipliers that each operator found, and note on which band and at what time. A multiplier found in a quiet hour on a low band is worth more effort than one found in a busy hour on a strong band. Look at the number of new multipliers per hour of search and pounce for each operator. This gives a fairer comparison than the total, because the totals depend on how many hours each spent on the search.
Also look at what the operator did with a rare multiplier: how long it took to work it, and whether it was logged correctly. The article on multipliers per hour and the one on multiplier strategy in CQ WW describe the way to read multiplier growth.
Errors per hundred QSOs
Accuracy is as important as rate. Take the QSOs that needed correction after the contest, such as busted calls and wrong zones, and assign each to the operator who made it. Then divide by the number of QSOs for each operator to get a rate per hundred QSOs. A raw count is unfair to the operator who made more QSOs, and the rate per hundred is a better measure. An operator with a high rate and many errors may be less useful for the team than one with a lower rate and few errors.
Contest Analyzer checks every callsign and every zone against official license databases and several independent reference sources and shows only the few QSOs worth a second look. The QSOs that you correct in the report give you the list of errors to compare. You can edit calls, zones, time and frequency, mark QSOs checked in your own audio recording and download a corrected Cabrillo. It works with Cabrillo from N1MM Logger+, DXLog and Win-Test, and the contests page lists the supported contests.
Fatigue and time of shift
Errors and rate depend on tiredness. An operator who takes the night shift will normally make more errors than one who takes the shift after a good sleep. Look at the hour of each shift and at the time since the operator’s last rest, and compare shifts that are similar in this respect. The article on fatigue hours and errors in the statistics and the one on operator fatigue and breaks in 48-hour contests help to separate real differences between operators from the effect of the hour.
If you see that both operators make more errors at night, the problem is not the person, but the schedule. A change in the order of shifts or a short rest at the right time might help both.
What the full statistics add
Besides rate and errors, the statistics give a broader picture of each operator’s style. Contest Analyzer shows rates, QSOs by hour and band, countries, continents, CQ and ITU zones, WPX prefixes, distance, beam heading, breaks and off time, and callsign length and structure. Look at the breaks of each operator: how often and for how long. Look at the countries and zones worked: did one operator cover areas that the other missed? And look at year-on-year comparison with your own logs to see how each operator changed from last year.
The picture becomes richer when you add what the numbers cannot show: who prepared the antennas, who kept the notes, who was ready to take over at a difficult hour. Include these in the discussion, and the numbers will become a tool for the team and not a threat.
Using the comparison
When you have the numbers, talk about them together. Start with what each operator did well, then look at the hard parts, and agree on one or two changes for the next contest. Perhaps one operator will take the run frequency on the best band, and the other will search for multipliers in the late hours. Perhaps both will agree to a short check of their exchange habits. Write the agreement down and read it before the next contest.
A repeated comparison over several contests gives much more reliable information than a single weekend. Keep the numbers from each contest in one place, and look at the trend. See year-on-year comparison of the same contest for tips on a fair comparison across years.
When the numbers mislead
Be ready for cases in which the numbers say something that is not true. A good example is the operator who takes over just before a band opens: the rate goes up, and the operator gets the credit. Another is the operator who takes the shift after a long run by the other, when the station has just built up a strong signal with callers, and who benefits from the pile-up that the first one created. A third is a technical problem that cost one of the operators an hour of work.
To avoid wrong conclusions, always ask what else could explain the difference. Look at the notes of the contest, ask the operators what they remember and compare with the numbers of other contests. If a pattern appears once only, treat it as a question. If it appears again and again, it is likely to be real. This is the same discipline as in any statistics work, and it protects you from unfair judgements.
It also helps to remember that the goal is shared. Two operators at one station are not rivals but partners, and the number that matters most is the result of the whole team. A small gain in the quality of the shared plan is worth more than any individual statistic.
Related reading
- Setting realistic goals from statistics
- Merging logs from several computers
- Hour-by-hour contest analysis
The bottom line
Put the two operators in the same conditions, separate running from searching and compare multipliers and errors per hundred QSOs. Use the results to share the work, not to name a winner.
FAQ
Is a higher rate always better?
No. Errors and multipliers matter too. Read all three together.
How do I handle different hours?
Compare only periods on the same band and a similar time of day.
How many contests do I need for a fair picture?
Several. One weekend can be dominated by luck.
Should I share the numbers with the operators?
Yes, in a friendly way, and with the purpose of planning the next contest.
Can the tool assign QSOs to operators?
It works from the log. You match the shifts from your own schedule.