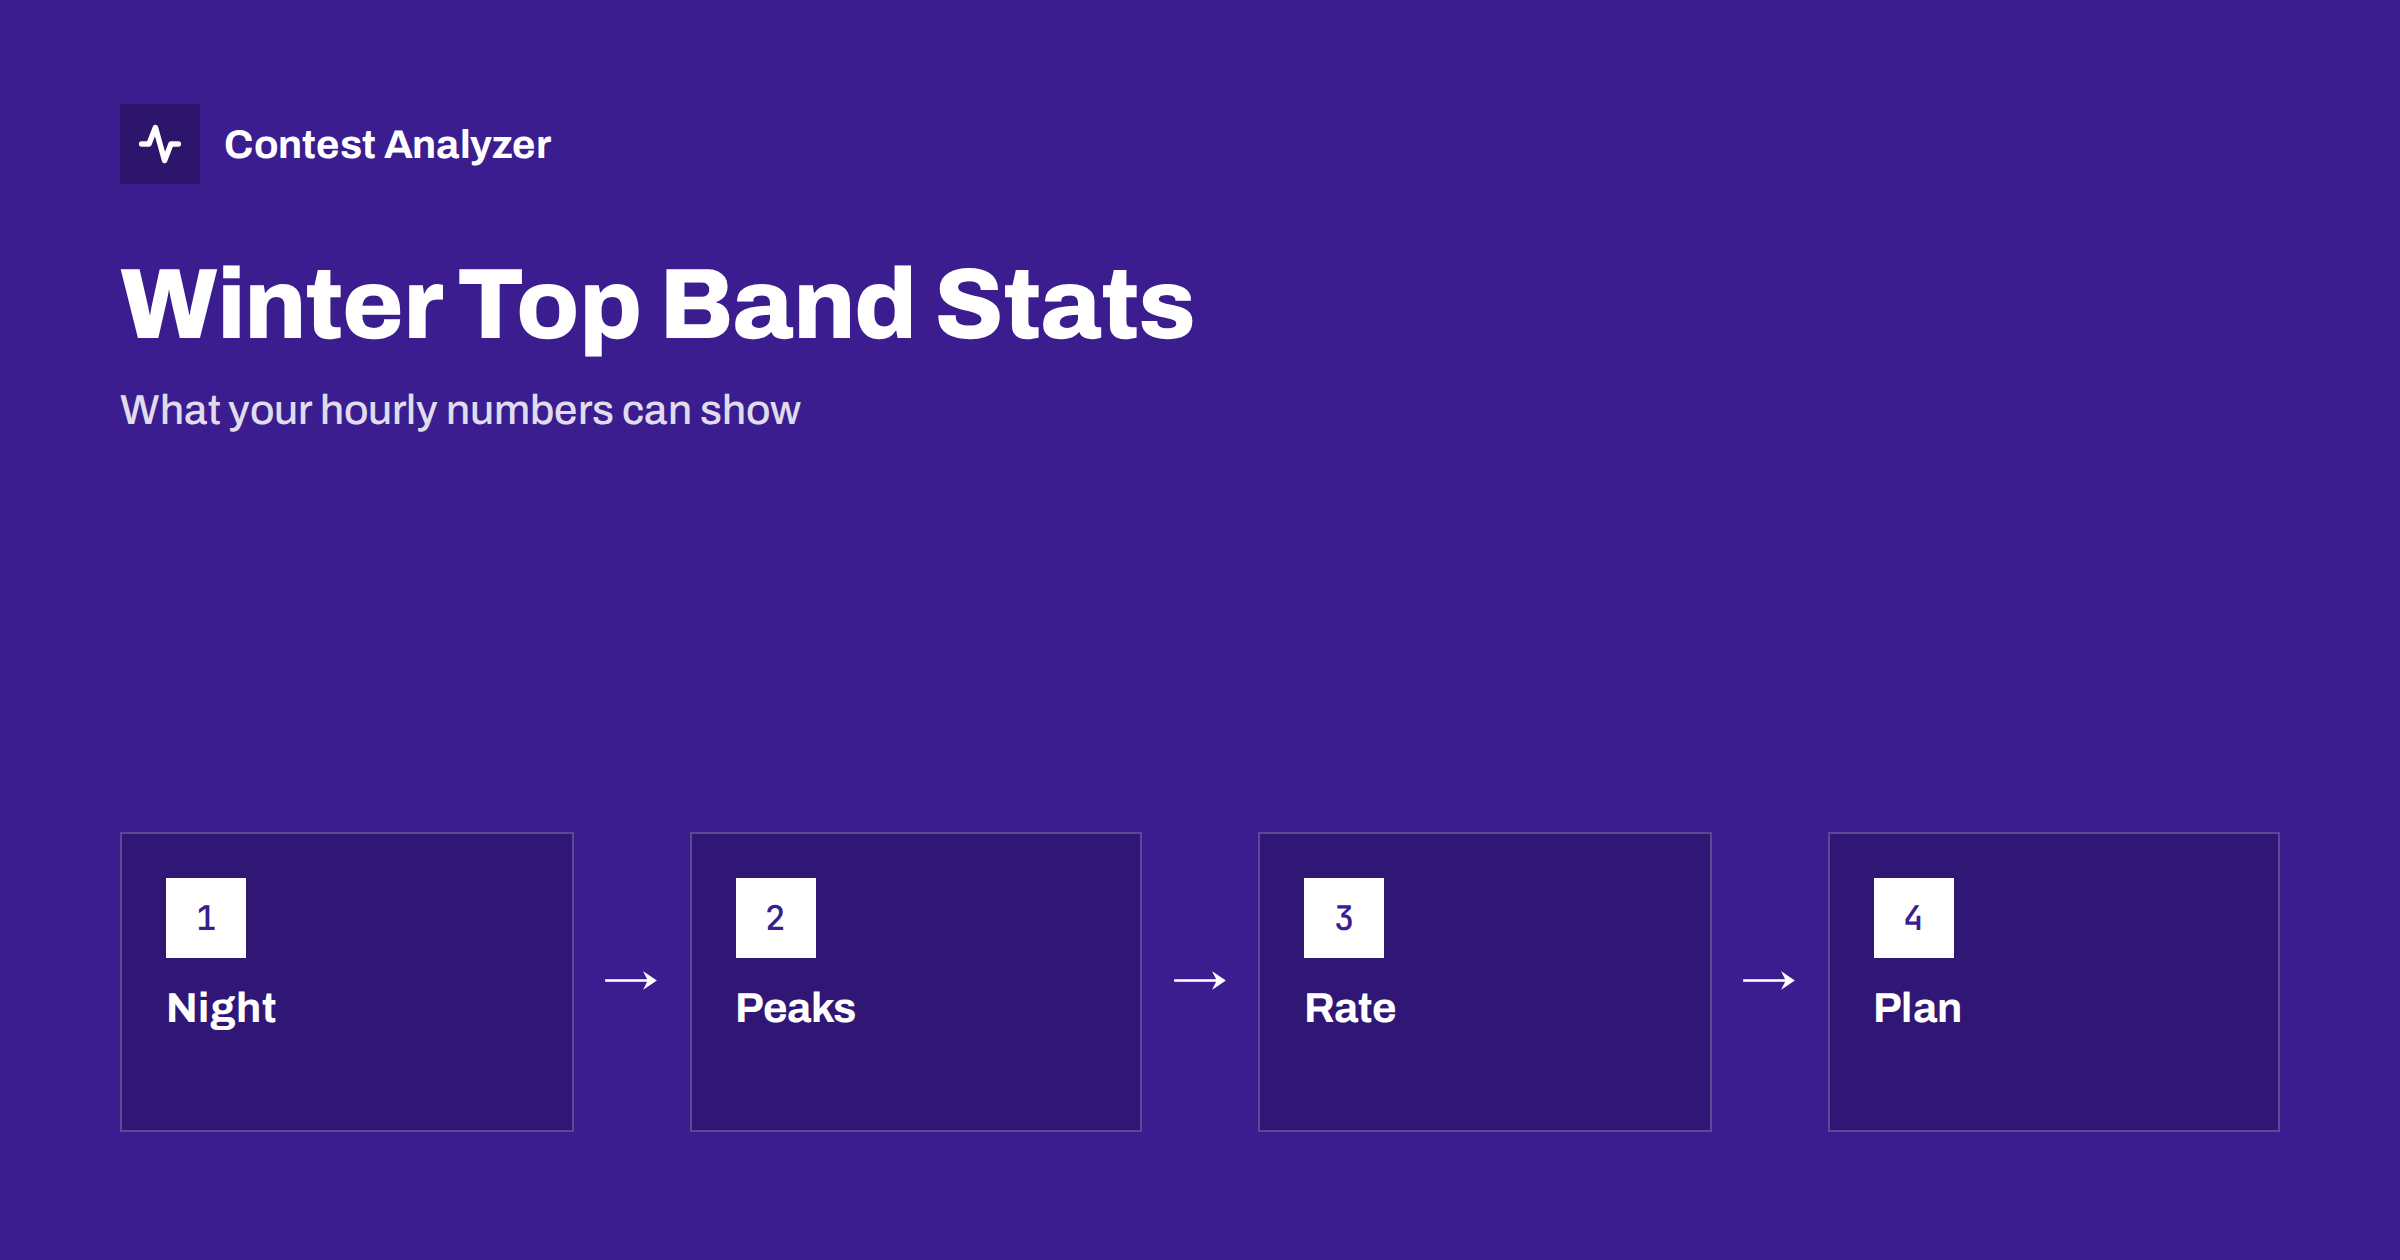
Short answer: Winter brings long nights, and with them the best conditions of the year on the lowest bands. A 160-metre or top-band contest log usually shows a distinct hourly pattern: a slow start in daylight, peaks around sunset and sunrise at the other end of the path, and a long quiet stretch at the deepest part of the night. Reading that pattern in your own hourly statistics helps you decide when to rest, when to push and what to expect next season.
Why winter suits the low bands
On the lowest HF bands, signals travel well in darkness and are absorbed in daylight. In the northern hemisphere, winter nights are long, so the period in which long-distance paths are open is much longer than in summer. Natural noise from thunderstorms is also lower in winter in many regions, which makes weak signals easier to copy. For these reasons, many operators keep their best top-band efforts for the winter months, and several contests on 160 metres are held in that season. Always check the current calendar and rules for the dates and the exchange of the contests you plan to enter.
For a contest log, the result is a distinct shape. The low band does not behave like a daytime band, where signals are good for many hours. It opens, peaks and closes along the path between you and the stations you want to work. The earlier articles on the CQ 160-Meter Contest, on low bands at night and on grey-line openings give context. This article concentrates on what to look for in the statistics.
The typical shape of the hourly curve
If you list QSOs by hour for a winter top-band contest, you will often see a pattern with four parts. In the first part, at the start of the contest and around local sunset, the rate rises as the band opens, first to nearby stations and then to more distant ones. The second part is the early night, when conditions are good over a wide area and the rate can be at its highest. The third is the deep night, when the number of new stations falls as you have worked most of the available ones, even though conditions are good. The fourth is the period around sunrise, when a second burst of openings often occurs on paths toward the west.
The shape depends on your location, the contest hours and the activity. A station in northern Europe has long darkness and a long period of good conditions; a station farther south has a shorter night. A contest that starts in the evening will begin with the opening and end after sunrise; one that starts at night may begin in the middle of the curve. Overlay your own hourly counts on these general expectations and note where you differ.
Peaks at sunset and sunrise
The transitions between day and night, often called the grey line, are known for enhanced propagation on the low bands. If your statistics show a clear peak in the hours around sunset and another around sunrise, you were exploiting this effect. If they do not, ask why. Were you on the band at the right time? Were you resting? Did a technical problem keep you off the air? A peak that you missed is information for next year.
Look at the continents as well. A sunrise peak toward the west, or a sunset peak toward the east, will appear as a burst of QSOs with a particular continent. The continent breakdown, together with the hourly counts, shows which openings you used. The article on openings to each continent hour by hour explains how to read this. In a top-band contest, a single hour with a rare continent can add multipliers that would have taken much longer at any other time.
Rates are lower, but the picture is richer
Top-band contests rarely produce the high rates of the higher bands. Antennas are harder to build, the signals are weaker, and the number of active stations is smaller. In your statistics, expect modest peak rates and a flatter profile. That is not a sign of poor work. What matters is the comparison with your own previous logs on the same band, and with the pattern that the band offers. A year-on-year comparison of your own hourly counts shows whether you gain from improved antennas and a better schedule.
Because the number of QSOs is small, each one matters more. A busted callsign costs a larger share of the total, and a missed multiplier is a bigger loss. The weak signals typical of the band also mean more repeats and more doubtful copies. Accuracy should therefore be a priority. See why logging errors cluster at night for the reasons and for ways to guard against them.
Plan your rest around the curve
In a long night contest, the operator is tired exactly when the band is best. The hourly curve helps to place the rest. A good plan is to rest in the hours when your own statistics show the lowest return, such as the deep night when you have already worked most of the available stations, or the middle of the day when the band is closed. Then be fresh for the sunset and sunrise peaks. If the contest has rules about off time for your category, check the current rules, and use the breaks view in your report to see how your rest was distributed.
Fatigue shows up in the errors. If you find more corrections in the hours before the sunrise peak, your rest came too late. The article on operator fatigue in 48-hour contests gives practical tips on rest.
Using a report to read the season
A report that shows QSOs by hour, band, continent and zone, and that supports year-on-year comparison with your own logs, is well suited to this analysis. Contest Analyzer provides these statistics for the contests it supports, among them CQ WW 160-Meter and the Stew Perry Topband Distance Challenge; the full list is on the contests page. It also checks every callsign and every zone against official license databases and several independent reference sources, so that the weak-signal QSOs of a night contest are reviewed before you submit. Serial numbers are not checked.
When you read the numbers, work through a fixed list of questions: when was the first QSO and the last; which hour was the best; which continents appeared and when; where were the gaps; and how did the shape differ from last year? Write the answers in your notebook with the date, the conditions and any changes to the station.
Prepare for next season
The winter season invites improvement. Antenna work on the lowest bands often has to be done in warm weather, so a plan made now, based on this year’s statistics, can be carried out before the next season. If the numbers show that you work few stations toward a certain direction, consider a receiving antenna or a change in the transmitting one. If the rate is limited by noise, work on the receiving side. If the curve suggests that you started late, set the start of operation earlier. Small, specific changes, recorded and tested, are the way of progress on the low bands.
What to write in the notebook
Low-band contests depend heavily on conditions that you cannot see in the log, so a few notes make the statistics far more useful. Record the time of local sunset and sunrise, the approximate level of noise, any storms nearby, the geomagnetic conditions if you checked them, and the antennas in use. Note the hours in which you felt that the band was open and the hours in which it was dead, even if the statistics later tell a slightly different story. Your impression at the time is part of the data.
When you compare years, these notes explain differences that would otherwise puzzle you. A weak year may simply have had a disturbed ionosphere or a severe noise problem. A strong year may have had a mild winter with little local noise. Without notes, you might credit or blame your own work for what was caused by conditions. With notes, you can separate the two and judge your improvements fairly. The article on solar flux and K index describes how conditions change results.
It also helps to keep a short list of the stations that gave you trouble: strong local noise sources, a neighbour’s equipment, or a station that always seems to be there at the same hour. Over several seasons the list reveals patterns, and you can prepare in advance, for example by choosing a different receive antenna at the hours when the noise appears.
A note on safety and comfort
Long winter nights at the radio are demanding in a physical sense. A cold room, a hard chair and bad lighting contribute to fatigue and errors. Keep the shack warm, the lighting soft but sufficient, and a hot drink within reach. If your antennas are outdoors, never go out in bad weather at night to repair them in a hurry; plan the checks before the contest, in daylight. A safe and comfortable operator makes fewer mistakes and enjoys the contest more, and that shows in the log.
Related reading
- Stew Perry Topband Challenge: Grids and Distance
- Low-Band Multipliers in CQ WW CW: Are They Worth It?
- Hour-by-Hour Analysis of a Contest Log: Gaps and Peaks
The bottom line
Winter top-band logs have a recognisable shape: openings at sunset and sunrise, a strong early night and a quieter deep night. Read your hourly and continent statistics against that shape, plan rest around the peaks, protect accuracy at weak signal levels and use the results to prepare your station for next season.
FAQ
Why are winter nights good for the low bands?
Darkness lasts longer, and low-band signals travel better at night, so the open period is longer and natural noise is often lower.
What does a typical hourly curve look like?
Often a rise at sunset, a strong early night, a quieter deep night and a second burst around sunrise, depending on location.
When is the best time to rest?
Usually in the hours with the lowest return in your own statistics, so that you are fresh for the peaks.
Where can I check dates and rules?
On the organisers’ pages and on the contests page. Always read the current rules before you operate.