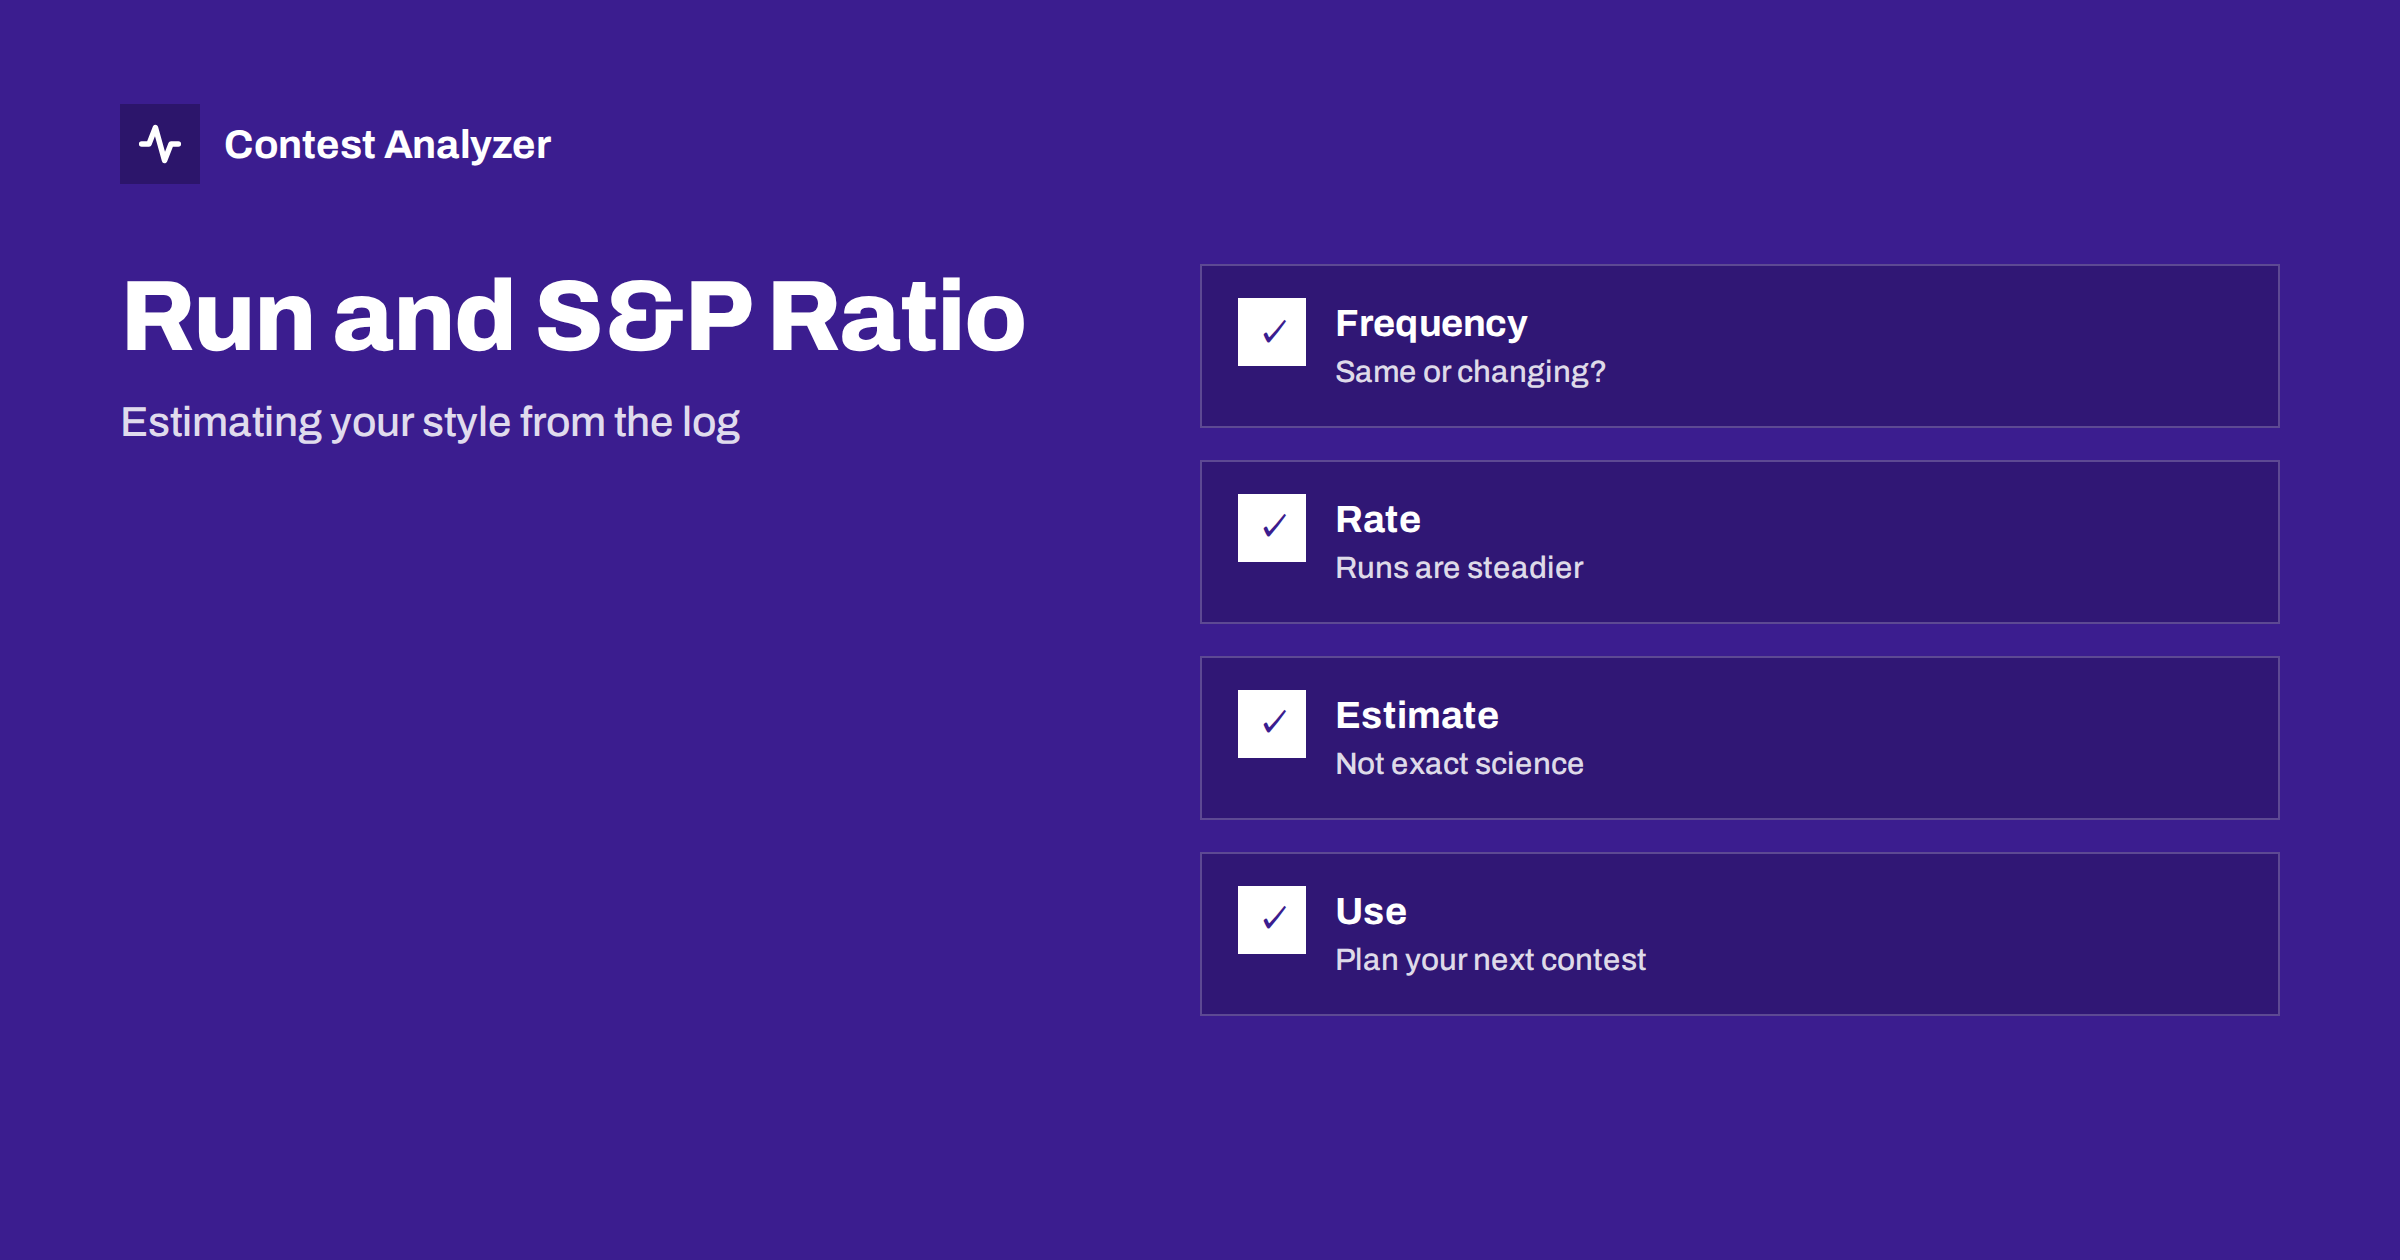
Short answer: A Cabrillo file does not say whether a QSO was made by running or by search and pounce, but the frequencies and the times give strong hints. Long series of QSOs on the same frequency are runs, and QSOs on different frequencies each minute or two are search and pounce. By classifying the log with a simple rule you can estimate your ratio, compare it between contests and see whether your style suits your station. The result is an estimate, so use it as a guide and not as a measurement.
Two ways of making QSOs
In running, you call CQ on a frequency and the other stations come to you. In search and pounce, often shortened to S&P, you tune across the band and call stations who are running. Each style has its advantages. Running can give a high and steady rate, particularly if you have a strong signal. Search and pounce gives access to multipliers and to stations that your own signal could not attract, and it needs little power. Most contesters use both, and the balance depends on the station, the band and the time.
The earlier article on run versus search and pounce explains how to measure each and when to switch. This article takes the next step: how to estimate the share of each from the log alone, without any special notes made during the contest.
What the log contains
Each QSO line has a frequency, a time and the callsigns. That is enough for a rough classification. When you run, your transmit frequency stays the same for a while, as the stations call you. When you search and pounce, your transmit frequency changes from one QSO to the next, because you move to the frequency of each station you call. So a run appears in the file as a sequence of QSOs with the same or almost the same frequency, and S&P appears as a sequence in which the frequency differs each time.
The frequency field in Cabrillo is the one the logger writes, usually the transmit frequency or the frequency of the radio. Check how your logger fills it: with split operation, the field may show the receive frequency rather than the transmit one. The article on working split in contests explains the question. In addition, an error in the frequency field, such as a wrong band, makes the classification unreliable; see wrong frequency in the log.
A simple rule to classify QSOs
A workable rule is the following. Take the QSOs in time order. Mark a QSO as a run if the frequency is within a small distance of the previous and the next QSO, and the three are close in time. Mark it as search and pounce if the frequency differs clearly from both neighbours. For the first and last QSO in a block, use the one neighbour that exists. A spreadsheet can do this with a formula that compares the frequency of each row with the rows above and below.
Choose the tolerance with care. Stations on a run may drift by a few hundred hertz, or the logger may show a slightly different value after a retune. A tolerance of about 1 kHz is a reasonable starting point, but you should test it on a part of the log that you remember. If you know that you ran on one frequency for two hours and the rule labels many QSOs as S&P, widen the tolerance. If it labels obvious S&P as a run, narrow it.
Compute the ratio
After classification, count the QSOs of each type and divide by the total. You may also count the time spent: the hours in which most QSOs were runs versus the hours in which most were S&P. The share of QSOs and the share of time do not have to match. Running usually produces more QSOs per hour, so a station that spends half the time on each style will have more than half of its QSOs from running.
It is useful to calculate the average rate for each type. The difference is a measure of the value of your run frequency compared to your search. If your rate on a run is only a little higher than in S&P, the run frequencies you pick are weak, or the conditions do not favour them. If the run rate is several times higher, running is clearly your strength, and you may want to spend more time at it. Compare this with the numbers in the rate meter article to avoid confusing short bursts with the steady level.
Where the estimate fails
The method has limits. A run that is interrupted by tuning to work a multiplier looks like a mix. A run with split operation can have a different frequency in each line, depending on the logger. A second radio, used in SO2R, breaks the pattern, since the contest operator alternates between a run on one radio and S&P on the other; see SO2R basics for contesters. A station that moves a little after every QSO to avoid interference looks like S&P. If you use any of these methods, interpret the numbers with caution.
Also remember that the log shows only the contacts, not the time spent calling without result. A long time of unsuccessful CQ is invisible, as is a long search without a QSO. A rate that looks low may have included such effort. A short note in the logger, such as the time you started a run or began to search, makes later analysis more accurate. See writing notes during a contest.
What the ratio can tell you
With a reasonable estimate in hand, look for patterns. Does the share of S&P rise in certain hours, such as when the main band closes? Does it differ by band? Does it vary between contests, or between years? A station that runs a lot at the start of the contest and moves to S&P later is following a common pattern. A station in which the share of S&P rises sharply when fatigue sets in may be better off with a planned rest.
The ratio also relates to multipliers. S&P is where most multipliers are found, so a very low S&P share may mean a modest multiplier count. If your multipliers lag behind the QSOs, a slightly higher S&P share in the right hours may improve the score. The article on multiplier strategy in CQ WW shows how to relate the two.
Use the statistics of a report
You can do the classification by hand, but a good report provides much of the surrounding data. Contest Analyzer’s statistics include rates and QSOs by hour and band, together with breaks and off time, and a year-on-year comparison with your own logs. These do not label each QSO as a run or S&P, but they give the framework for your own estimate: the hours and bands in which you were fast, and those where you were slow. Combine them with the frequency pattern and your notes.
A small example
Consider a hypothetical stretch of the log with ten QSOs. Six of them are on 14 025 kHz within two minutes of each other; the next four are at 14 018, 14 041, 14 033 and 14 012, each separated by a few minutes. With a tolerance of 1 kHz, the first six are classified as a run and the last four as S&P. The run produced six QSOs in perhaps eight minutes, and the S&P produced four in about fifteen. The rates are about 45 and 16 per hour. The example is made up, but it shows why the two styles give such different numbers.
Repeat the calculation for each hour and the log becomes a table: in the first hour, 80 percent of QSOs were runs; in the third, 30 percent; in the fifth, 60 percent. Mark the hours on a chart of band against time. You will often find that the S&P share rises when a band is closing, and that new runs begin after a band change. That is a good moment to ask whether the change was prompt or late.
One more use of the table is to check consistency between contests. If you ran the same contest last year and the same table shows a lower run share, ask whether you had a weaker frequency, a weaker signal, or simply a different plan. The answer will point to a concrete action: improve the antenna, claim a better frequency earlier, or accept the new plan.
Advice for a better balance
If your estimate shows that you ran very little and your rate on the run was high, try holding a good frequency longer next time. If it shows that you ran a lot and your multiplier count was low, plan short S&P periods to collect multipliers. If your run rate is low in most hours, work on the signal and the CQ routine: a short, clear CQ, a quick exchange, and a prompt response to callers make a big difference. Small changes, tested one at a time, are the way to improve.
Related reading
- A Second Receiver for Search and Pounce While You Run
- Band Strategy by Hour: Plan Your Next Contest
- The First Hour of a Contest: Start Strong, Learn Fast
The bottom line
You can estimate the run and S&P ratio from a log by looking at how the frequency changes from QSO to QSO. Pick a tolerance, classify, compare the rates and read the pattern by hour and band. Treat the result as an indication, remember the limits, and use it to plan where to run and where to hunt in the next contest.
FAQ
Does Cabrillo store whether a QSO was a run?
No. The file holds frequency, time and callsigns only, so the style must be estimated from the pattern.
What tolerance should I use?
About 1 kHz is a starting point. Test it on a part of the log you remember and adjust.
Does split operation affect the estimate?
Yes. Depending on the logger, the frequency field may show the receive frequency, which makes the classification less reliable.
Is a high S&P share bad?
Not necessarily. It depends on your station, the band and your multiplier needs.