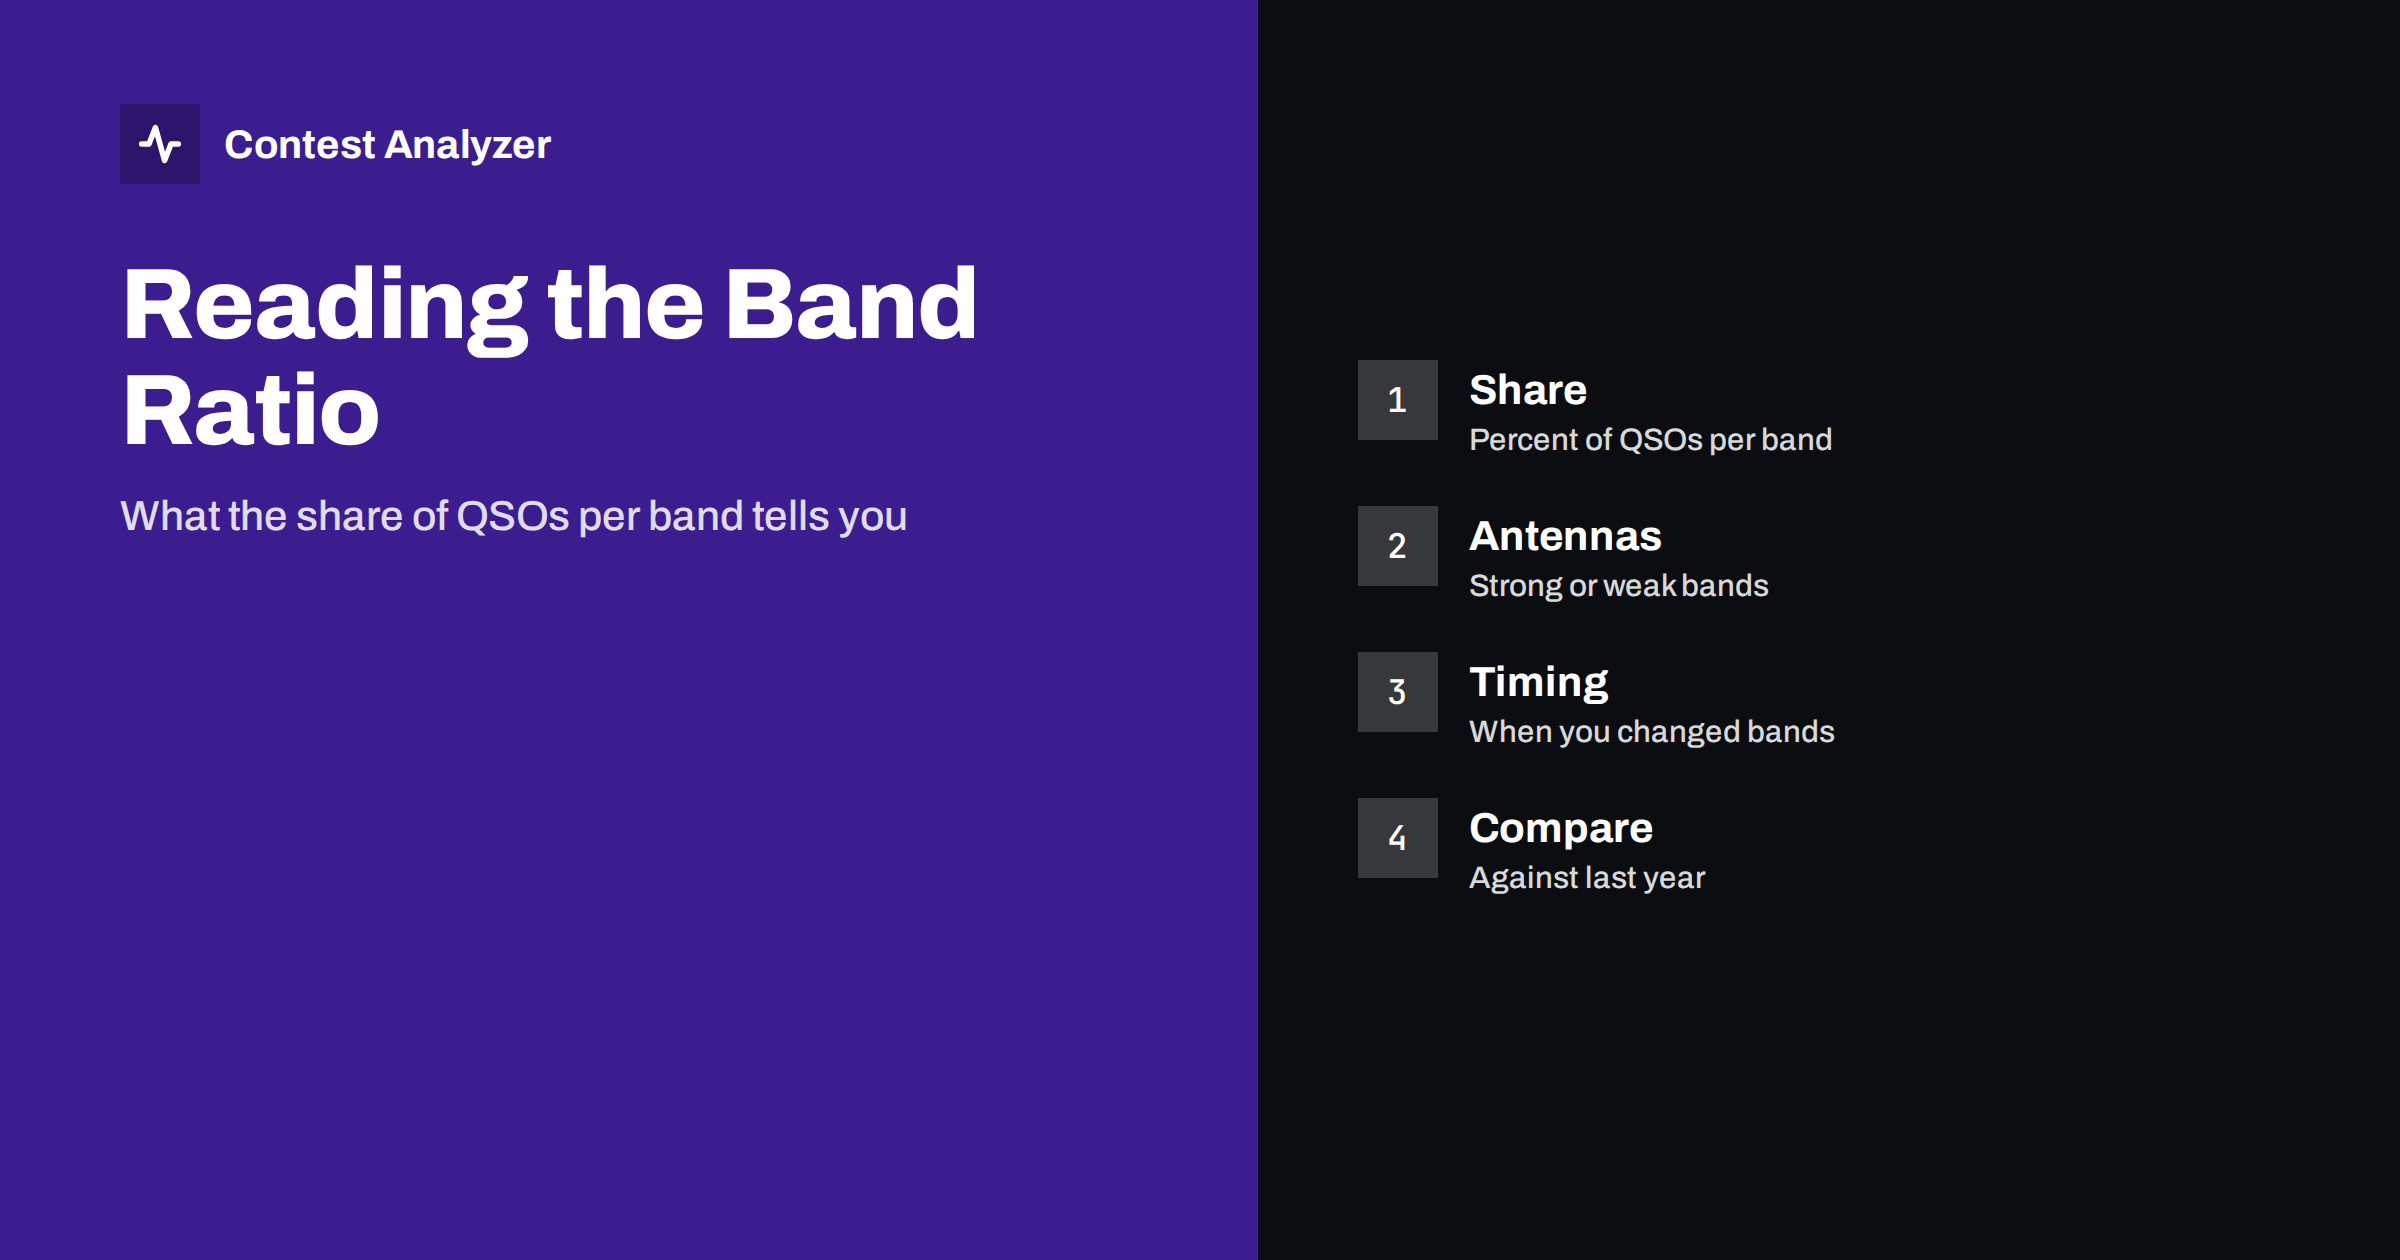
Short answer: The band ratio is simply the share of your QSOs made on each band. By itself it is just a table of percentages, but read together with the hours, your antennas and the propagation, it shows where your station is strong, where it is weak and whether your band changes were well timed. It is not a target to hit. A band with a low share may be a sign of a problem, or it may be the result of a correct decision to leave a closed band. The numbers raise questions; your knowledge of the contest gives the answers.
What the band ratio is
When you take all the QSOs of a contest and count how many were made on each band, you have the QSOs by band. Divide each figure by the total and you have the band ratio: for example, a certain percentage on 80 metres, another on 40 metres, and so on. The statistics in your report show QSOs by band and by hour, and from them the ratio is a simple calculation. Many contesters look at the absolute numbers and miss the information that is easiest to see in the shares.
The shares are useful because they are independent of the total. If you made twice as many QSOs this year as last year, the absolute figures are all larger, but the ratio shows whether the proportions changed. A shift from one band to another, with the same total, says something about conditions or about your own choices, and that is the starting point for a better plan.
A small example
The table below uses invented numbers, only to show how to read such a table. It is not a reference or a target.
| Band | QSOs | Share | First question to ask |
|---|---|---|---|
| Low band A | 180 | 15% | Was it open long enough, and was the antenna good enough? |
| Low band B | 300 | 25% | Which hours gave most of these? |
| Middle band | 360 | 30% | Is this a strength, or only the band that was open for longest? |
| High band A | 240 | 20% | Did the opening arrive when expected? |
| High band B | 120 | 10% | Closed, or not tried at the right time? |
The table does not tell you what happened. It tells you which bands to look at first, and the answer comes from the hourly figures and from your notes.
What a high share can mean
A band with a large share of QSOs usually means one of three things, and they are not mutually exclusive. The first is that the band was open for a long time during the contest, as sometimes happens with a middle band that stays usable around the clock. The second is that your antenna on that band is good: a large share, together with a good rate on the same band, suggests a strength. The third is that you stayed there longer than you needed to, out of habit or comfort, while another band offered more. The way to tell them apart is to look at the rate by band. If the rate on the favourite band was high, the share was earned. If it was lower than on other bands, you may have been running on a band that no longer paid.
What a low share can mean
A low share is more difficult to judge. It may be that the band was closed during most of the contest, which is a matter of propagation and season. It may be that your antenna on that band is weak or the local noise is high, which is a matter of the station. Or you may have arrived late: the contest was already half over when you tried the band. A single low share is not a verdict.
It is more informative to look at the hours when the band should have been open. If a band was open and your share is still low, ask what you did during those hours. Were you on another band that was doing better, or did you leave a good opening unused? The article on band strategy by hour shows how to read QSOs by hour and band together, and the one on hour-by-hour analysis adds the view of gaps and peaks.
Antennas, power and the shape of the ratio
The band ratio is often a mirror of the station. A station with a good low-band antenna and a small high-band one will have a very different ratio from one with the opposite set-up, even in the same conditions. If you changed an antenna between two contests, compare the ratios before and after. If a band went from a small share to a larger one and the rate improved with it, you have a measure of the change, though other conditions must be considered as well.
The ratio can also show a limit imposed by the category. In a category with restrictions on power or band changes, the shape is part of the rules. In other cases, the rules may include limits on how often you may change bands or on operating time, which affect the ratio indirectly. Always compare ratios from contests with similar rules. The article on band-change rules for multi-operator entries explains why some categories restrict the way bands are used.
Timing: when did you change bands?
The ratio shows how much you did on a band; the hourly view shows when. Both are needed. A typical lesson is that operators leave a band too late, because the rate is still good, and arrive on the next one after the best part of the opening has passed. Another is that they change too often and lose time retuning. If your band changes cluster in certain hours, check the rate before and after each change.
It is useful to note on the plan page which band you expect to use at which hour, and to compare the plan with the report afterwards. The plan comes from the schedule and the sunrise and sunset times described in the article on planning your contest in UTC, and the result comes from your statistics.
Comparing with your own earlier logs
The most reliable comparison is between your own contests, as the station, the operator and the rules are similar. If the ratio is almost the same from year to year, the shape is dominated by the station and your habits. If it changes, look for causes: conditions, antennas, or choices. The article on solar flux and contest results explains how propagation can change the picture from year to year, and it is a reminder to be careful when you draw conclusions.
Contest Analyzer supports this kind of comparison. It gives full statistics, with QSOs by hour and band, rates, countries, continents, CQ and ITU zones, WPX prefixes, distance, beam heading, callsign length and structure and your breaks and off time, and a year-on-year comparison with your own logs. At the same time it checks every callsign and every zone against official license databases and several independent reference sources and shows only the few QSOs worth a second look; you can edit calls or zones in the report and download a corrected Cabrillo. It works with Cabrillo from N1MM Logger+, DXLog and Win-Test, and the interface is available in 25 languages. The contest list shows the 22 contests it supports.
Band ratio and multipliers
In contests where multipliers are counted separately on each band, such as the CQ WW contests, the band ratio has a second meaning. A band with a very small share is also a band on which you collected few multipliers, and an extra hour spent there may have been worth more than it looks from the QSO count alone. In contests where multipliers count once for the whole event, the same logic does not apply, and a thin band costs only the QSOs. Check the multiplier rule of the contest you are reading, and see the article on multiplier strategy in CQ WW for the per-band case.
How to use the ratio in practice
- Look at the shares first, then ask which bands surprised you.
- For each surprise, open the hourly view and find the hours when the band was used.
- Compare with the rate on that band and with the other bands in the same hours.
- Think about the station: antenna, noise, power, the direction of the beam.
- Write one note for next time, such as “try the high band earlier” or “improve the low-band receive antenna”.
Related reading
- Band strategy hour by hour
- Hour-by-hour analysis of a contest log
- Continent breakdown of a contest log
The bottom line
The band ratio is a quick, honest picture of how you spent the contest. It does not tell you what you should have done, but it points to the bands worth a closer look and to the questions that matter: was it propagation, was it the station, or was it a choice? Read it together with the hours and the rate, compare it with your earlier logs and turn the answer into one concrete improvement for the next contest.
FAQ
What is a good band ratio?
There is no ideal ratio. It depends on the contest, the season, your station and your location. Compare it with your own earlier results rather than with a fixed figure.
Should I try to even out the bands?
Not for its own sake. If a band was closed or poor, a low share is correct. Look at whether you used the hours when each band was open.
Does the band ratio matter in single-band entries?
No, in a single-band entry all QSOs are on one band. The hourly view is more useful there.
Where do I find QSOs by band?
The statistics in the report show QSOs by hour and band, from which the shares are easy to calculate.
Can I compare the ratio between two contests of different types?
Only with care. Contests differ in duration, bands and rules, so compare like with like.