Short answer: The hourly view of a Contest Analyzer report shows how many QSOs you made in each hour of the contest and how they were spread over the bands. Read it from top to bottom as the story of your weekend: the start, the peaks, the quiet hours, the breaks and the end. Then compare it with your notes and with earlier years, and write down what you would change.
What the report offers
When you upload a Cabrillo log, Contest Analyzer produces full statistics next to the check of callsigns and zones. The statistics include rates, QSOs by hour and band, countries, continents, CQ and ITU zones, WPX prefixes, distance, beam heading, breaks and off time, and callsign length and structure. The hourly view is one of the most useful, because it connects all the others to time: it shows when things happened, not just how many.
The exact layout of the report can change as the service develops, so treat this article as a method for reading hourly numbers and not as a screen guide. The idea is common to any hour-by-hour statistic, and our general article on hour-by-hour analysis of a contest log explains the background.
Read the rows as hours of the contest
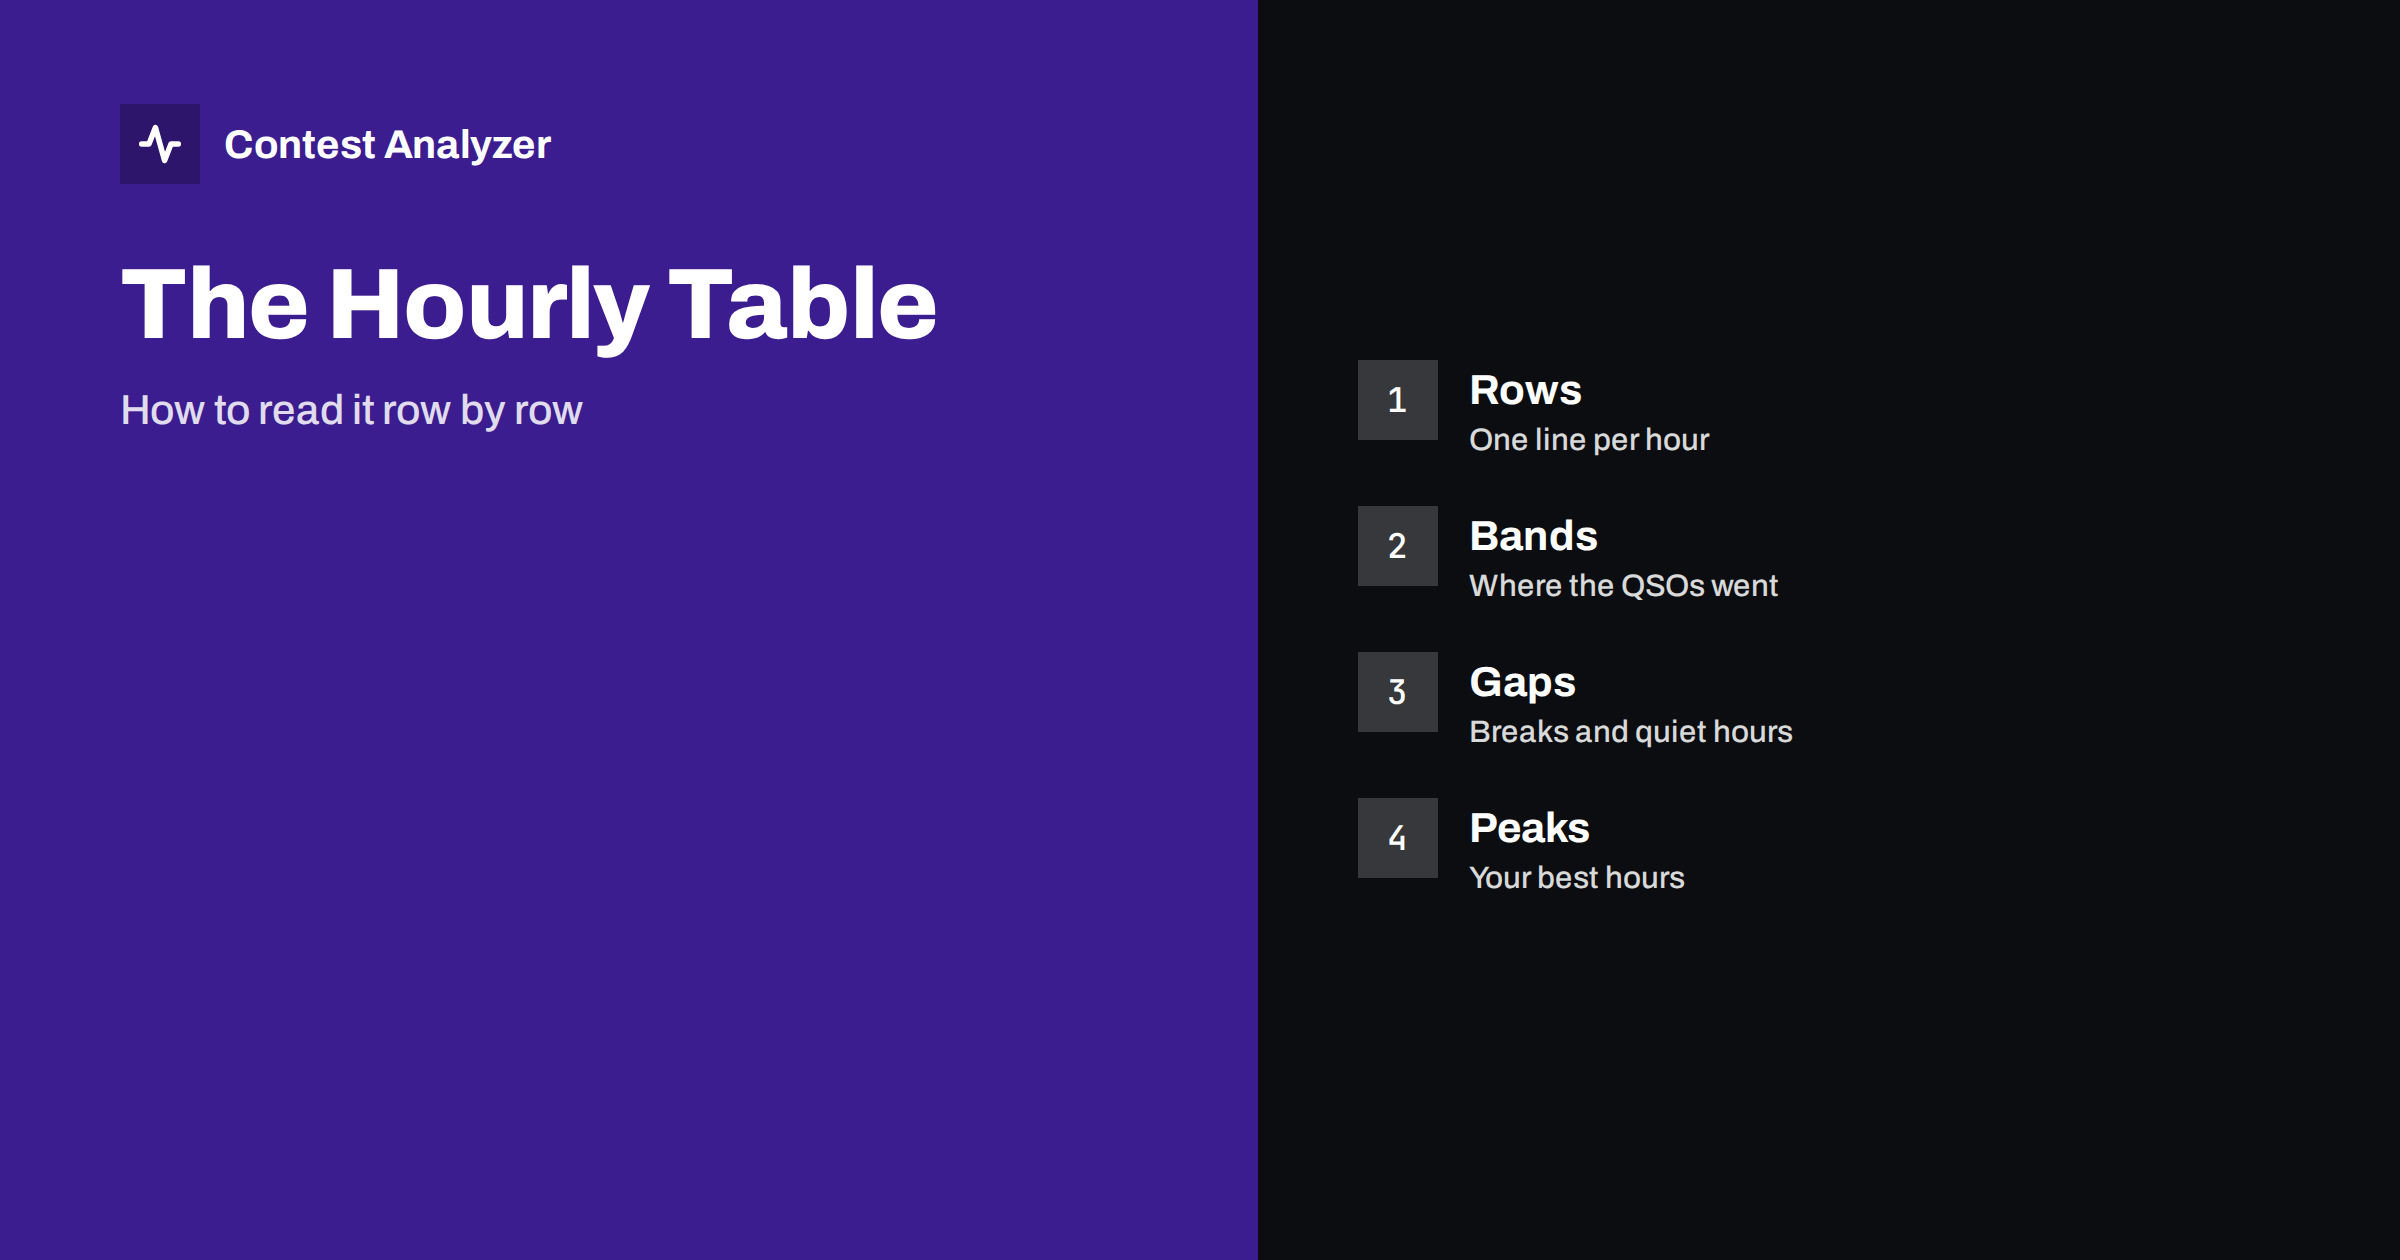
Each row of an hourly table stands for one hour in UTC, usually from the start of the contest to its end. In a 48-hour contest you will see forty-eight of them, or fewer if you were on the air for a shorter period. The first thing to do is to find the first row with QSOs in it and the last. Compare the hours with the official start and end, and with your own memory. A first row that is empty because you started late, or a last row that contains a single QSO, tells you something already.
Then read down the column of totals. Look for the shape of the curve: does it rise to a peak in the first evening, fall at night and rise again the next day? That is the usual pattern for a station that works both day and night bands. A flat curve may mean steady operation or a weak signal that never reached a high rate. A very jagged curve often reflects short breaks, changes of band or interruptions.
Read across: the bands
For each hour, the band split shows where the QSOs were made. Read each row from left to right. In some hours one band holds nearly all the QSOs, which means a long run on a good frequency. In others, the QSOs are spread over three or four bands, which suggests searching and band changes. Neither pattern is good or bad in itself. What matters is whether it matches your plan.
Compare the rows with the time of day. You would expect the lower bands at night and the higher bands in the daytime. If your best hours were on a band that you did not plan to use, consider why. Perhaps conditions favoured it, or perhaps you stayed on a band too long after it declined. The article on band strategy by hour shows how to use such a pattern to plan the next contest, and the one on a band-by-hour picture shows another way to see the same data.
Find the peaks
Mark the three best hours. What was happening in them? Look at the band, the number of countries and zones and the type of contacts. Often the best hour was a long run on a band that was wide open to a region with many active stations, and you were on a clear frequency with a good signal. If that is the case, ask how you could have been there for more hours.
Also compare the peaks with the average. If your best hour was three times your average, the contest was decided by a small number of strong hours, and your plan should protect them: be fresh, be on the right band and have the station in order. If the peaks and the average are close, you had steady operation, and the gains will come from raising the whole level. The article on contest rates explains how to think about the numbers.
Find the gaps and breaks
Now read the weakest hours. An hour with no QSOs is a break, planned or not. Several empty hours in a row are a long rest. The report also shows breaks and off time, which helps you check how your rest was distributed. For categories where off time is limited, the rules decide how it is counted, and the figures in the statistics are a guide only: check the current rules of the contest. The article on off-time rules for single operators gives the general picture.
Look at the hours just before and after a break. A good break is followed by a good hour. If the rate after a break was lower than before, you may have rested at the wrong time or for too long. If the rate before the break was falling anyway, the rest may have been well chosen, and the first hour after it should show a recovery.
Read the quiet hours that are not breaks
Some low rows are not breaks at all. They are hours in which you were on the air but made few QSOs. This could be a band that was quiet, a search for multipliers, a technical problem or tiredness. To tell them apart, open your notes and the time of the problem, and look at the countries and zones in those hours. A quiet hour with several new multipliers is productive in a different way. A quiet hour with nothing new, on a band that was closed, was a loss.
The statistics of this kind are the base of the comparison with other years. If the same hour is weak every year, something structural may be involved, for example an antenna that does not work toward the right direction at that time, or a habit of taking a meal then. Our article on finding your tired hours in contest statistics deals with another aspect of the same pattern.
Combine the hourly table with the check
The hourly view and the error check complement each other. Contest Analyzer checks every callsign and every zone against official license databases and several independent reference sources and shows only the few QSOs worth a second look. It also marks QSOs outside the contest period and outside the band limits for your ITU region, with split QSOs shown as a note. If the QSOs to check cluster in certain hours, those hours may have been tired or difficult ones. You can edit calls, zones, time and frequency in the report, mark QSOs as checked in your own audio recording and download a corrected Cabrillo file. Serial numbers are not checked, and dupes are not errors.
Write it down
Finish with a short note for your notebook: the best three hours, the weakest three, the longest break and the one change you want to try. Add the date and the conditions. Next year, upload the new log and compare the hourly picture with this one. Year-on-year comparison with your own logs is part of the service, and the pricing page shows the plans, which differ in log size. The supported events are on the contests page.
A sample reading
Suppose a 48-hour log shows this: the first hours are strong on 20 m, the evening moves to 40 m, the deep night has a long gap of three hours, and the second morning is weaker than the first. A good reading would go like this. The strong start tells you that preparation worked. The move to 40 m in the evening is normal. The three-hour gap is a rest, and the question is whether the rate before it was already falling. The weaker second morning raises the question of tiredness or of conditions, and your notes answer it.
From this reading, three decisions follow. One: keep the plan for the start. Two: move the long rest to the hours when the curve is flattest, so that the second morning begins with a fresher operator. Three: look at the second morning in the previous year’s log to see if the dip is a pattern. Each decision comes from a specific row of the table, and each can be tested in the next contest. This is the kind of use that makes statistics worth the time, in contrast to simply admiring the totals.
If you operate in a team, share the hourly view with the others and discuss it. Each person sees different things in the rows, and a conversation of ten minutes often produces a better plan than any individual reading. The same method works for a single-operator station, with the notebook taking the role of the second person.
Related reading
- Reading Your Statistics After the First 24 Hours
- Off Time and Breaks in Contest Rules: Plan Them Well
- Same Contest, Two Years: What Really Changed?
The bottom line
Read the hourly table as a story: first row to last, totals first and then bands, peaks, gaps and breaks. Link every finding to a cause, write down one change and compare next year. The numbers become useful only when you act on them.
FAQ
What does one row in the hourly view mean?
One hour of the contest in UTC, with the QSOs made in it and their distribution over the bands.
How do I find breaks?
Look for hours with no or very few QSOs, and use the breaks and off-time statistics in the report.
Can I compare with last year?
Yes. The service supports year-on-year comparison with your own logs.
Are serial numbers part of the check?
No. Callsigns and fixed items such as zones are checked, while serial numbers are not.