Short answer: A Contest Analyzer report gives you full statistics for your log, including rates, QSOs by hour and band, countries, continents, zones, prefixes, distance, beam heading, breaks and off time. The rate and band numbers are the best place to start, because they show the shape of your weekend: when you were fast, when you were slow and which bands carried the contest. This article explains how to read them and which questions to ask, without relying on any particular layout of the screen.
Where these numbers come from
When you upload a Cabrillo file for a supported contest and the background check is complete, the report shows two things side by side. One is the short list of QSOs that deserve a second look, found by checking every callsign and every zone against official license databases and several independent reference sources. The other is the statistics: a description of your log as a whole. The statistics are computed from the QSO lines in your file, so they are as accurate as your log. If the clock was wrong or the band field was wrong, the numbers will show it.
The exact appearance of the report can change as the service develops, so open your own report as you read this and look for the numbers described here. If you do not have a report yet, read the short steps on the FAQ page and start with your most recent contest.
Rates: how fast you worked
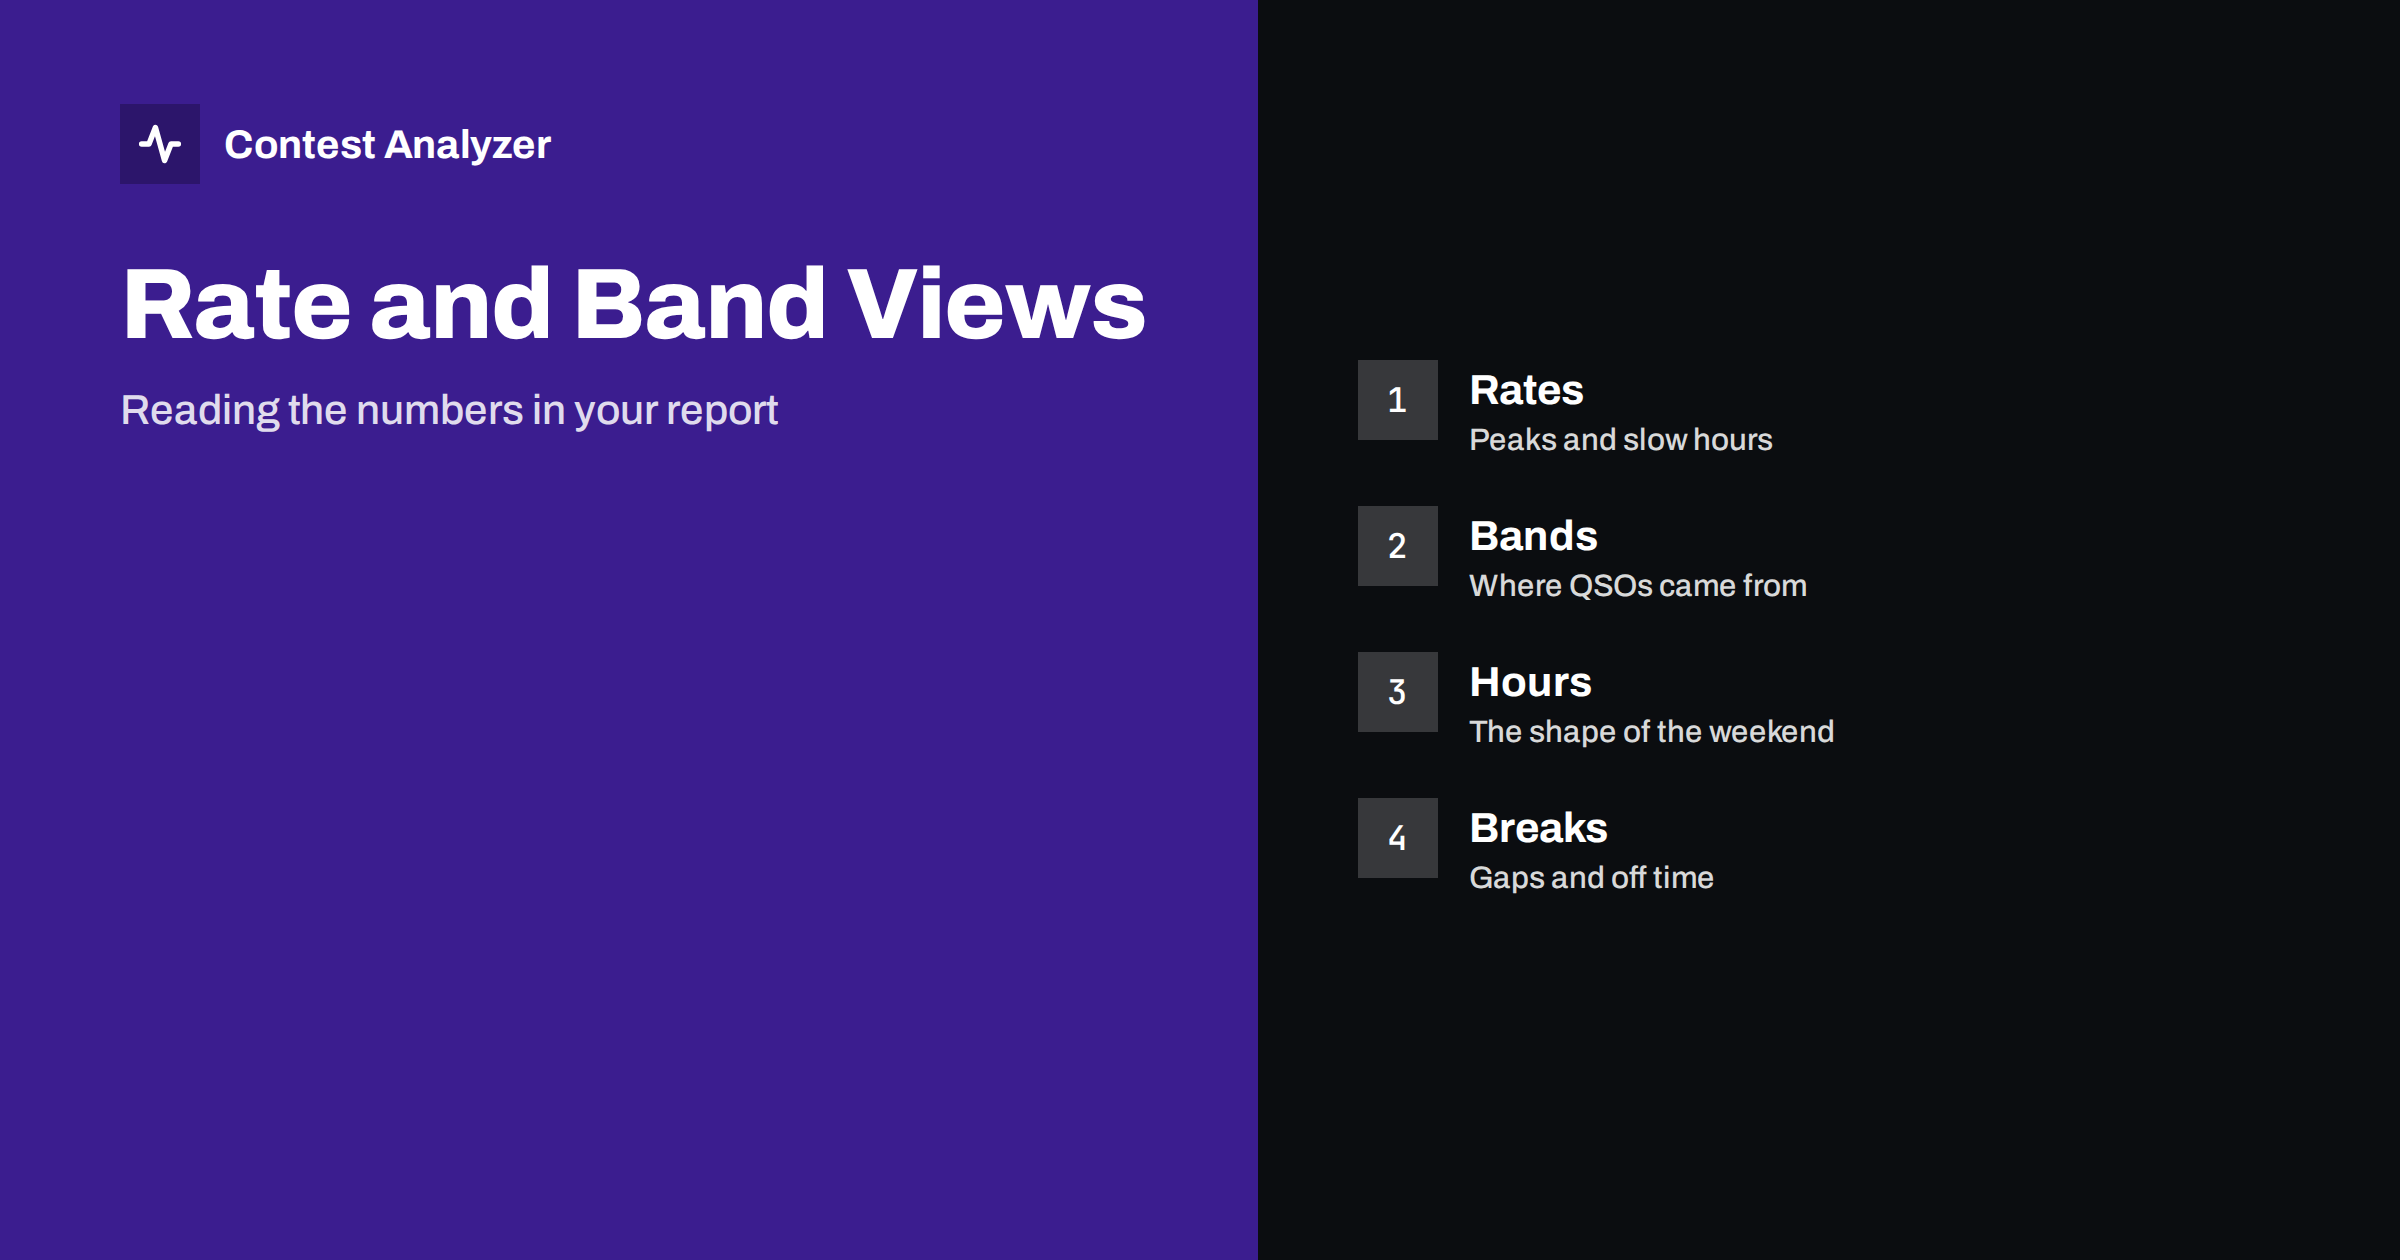
The rate is the number of QSOs per unit of time. The statistics show it in various ways, such as the number of QSOs in each hour and the best rates you reached over shorter periods. For each, the first question is simple: when were the peaks? A peak means that you had a good band, a good frequency and a flow of callers. Note the time and the band of each peak. These are the periods that make or break the contest, and next year you should be ready for them.
The second question is about the valleys. A slow hour can have many reasons: a band closing, a change of band, a break, an equipment problem, or a long period of search and pounce. By itself the number does not tell you which. Combine it with the band view and with your station notes. Our article on the rate meter during a contest explains why 10-minute and 60-minute rates show different things: short rates reveal bursts, long rates reveal the steady level.
QSOs by hour: the shape of the weekend
When you list the QSOs by hour in order, you see the shape of the contest for your station. Typical shapes are a strong start, a dip at night, a second peak the next day and a decline near the end. Each station has its own typical shape, set by its location, antennas and operator. Learning your own shape is the first step to improving it.
Look for the hours that do not fit the pattern. An unexpected dip in the middle of a good period is a candidate for investigation. An unexpected peak, on the other hand, tells you what worked, and you should write down why. The method is described in more detail in hour-by-hour analysis of a contest log. Compare also with last year’s numbers for the same contest, if you have uploaded that log, since the year-on-year comparison shows whether the shape is changing.
QSOs by band: where the contest happened
The band view shows how many QSOs you made on each band, and how this changed during the weekend. A first reading is the share: which band gave you the most contacts, and which gave you the least? The second reading is the time: when did you use each band? A band with many QSOs in a short window usually means a strong opening that you exploited; a band with few QSOs spread over many hours suggests that you checked it without much result.
Ask what the band view says about your station. If a band is weak in every contest, the antenna for that band is a probable cause. If a band is strong only in certain hours, the cause is propagation. The article on band ratio in contest statistics discusses what the share can and cannot tell you. Do not draw conclusions from a single contest; patterns that repeat over several years are more reliable.
Combine the two views
The most useful reading comes when you put rate and band together: in which hour, on which band, were you fast? A table of hours against bands, which many operators build by hand, answers this directly. Find the cells with the highest values and ask whether you were on that band at the right time, and whether you stayed long enough. Find the cells where you spent a lot of time with low output, and ask whether another band would have been better.
A related question is the number of band changes. Every change costs some seconds of tuning, and in the first minutes on a new band the rate is often lower. If the statistics show many short visits to different bands, with low rates on each, you may be changing too often. The article on band changes and rate gives practical guidance. The point is not to stay on one band, but to know the cost of leaving it.
Breaks and off time in the report
The report also lists breaks and off time. Read them next to the rate numbers. A long break before a strong hour may have been a good decision or a lucky one; a break in the middle of an opening is a question. If your category counts off time, check the current rules for how it is counted. The report is an aid for your own analysis, and the organiser’s rules are the authority for scoring.
When you look at a break, compare the rate of the hour before and after it. If the rate after the break is clearly better, the rest helped. This kind of small experiment, repeated in several contests, is how statistics turn into a plan.
Other numbers that complete the picture
Rate and band are only part of the report. Countries, continents, CQ and ITU zones and WPX prefixes show what you worked; distance and beam heading show where your signals went; callsign length and structure show the kinds of stations that answered you. Each is a lens on the same log. For example, a continent that is almost absent from your numbers may point to an antenna direction that was not used, or to a time when that continent was not open.
It is easy to be overwhelmed by the amount of data. A good approach is to pick three questions before you open the report: when was my best hour, which band was my best and where was my biggest gap? Answer them first, then explore the rest with curiosity. Write the answers in your station notebook, with the date, so that they can be compared later.
What the numbers cannot tell you
Statistics describe what happened, not why. A drop in rate may be caused by propagation, by competition, by tiredness or by a technical problem, and the numbers alone cannot separate these. Your memory, notes and any recordings fill in the missing context. Also remember that serial numbers are not checked, and dupes are not errors, so those aspects of the log need your own review.
Finally, be careful to compare like with like. A different category, a different mode or a different year with different conditions can change the numbers a lot. The comparison of your own logs is most informative when the contest and the category are the same. See same contest, two years for a method.
A short routine for each report
To make the reading repeatable, follow the same order every time. First, note the total QSOs and the best hour. Second, list the three bands with the most QSOs and the hours in which each was used. Third, mark the longest break and the two slowest hours. Fourth, compare those four items with the previous year’s report if you have one. Fifth, write one sentence about what you will change next time. The whole routine takes about fifteen minutes and gives you a record that can be compared year after year.
If you operate with a club, share the routine: when everybody reads their reports in the same order, the discussion afterwards is much more productive, because each person can say which hour, which band and which gap mattered most for them.
Related reading
- Hour-by-Hour Analysis of a Contest Log: Gaps and Peaks
- Reading a Band-by-Hour Picture of Your Contest
- The Rate Meter During a Contest: 10 vs 60 Minutes
- Supported contests
The bottom line
The rate and band statistics in a Contest Analyzer report describe the shape of your weekend. Read the peaks and valleys by hour, the share and timing by band, and then put them together. Use the numbers to ask better questions, and remember that they need your notes to explain the why.
FAQ
Which statistics does the report include?
Rates, QSOs by hour and band, countries, continents, CQ and ITU zones, WPX prefixes, distance, beam heading, breaks and off time, and callsign length and structure.
Can I compare with previous years?
Yes. The report supports year-on-year comparison with your own logs.
Are serial numbers part of the check?
No. Serial numbers are not checked, so review them yourself if you want to be sure the sequence is clean.
Where do I check which contests are supported?
On the contests page, which lists the supported contests with their dates.