Short answer: A band-by-hour picture puts the bands in rows and the hours in columns, and shows the number of QSOs in each cell. At a glance you see when each band worked, when you moved, where the rate peaked and where it fell. Read it in three passes: first the overall shape, then the band transitions, then the gaps. Each pass leads to a question that you can test in your next contest.
What the picture shows
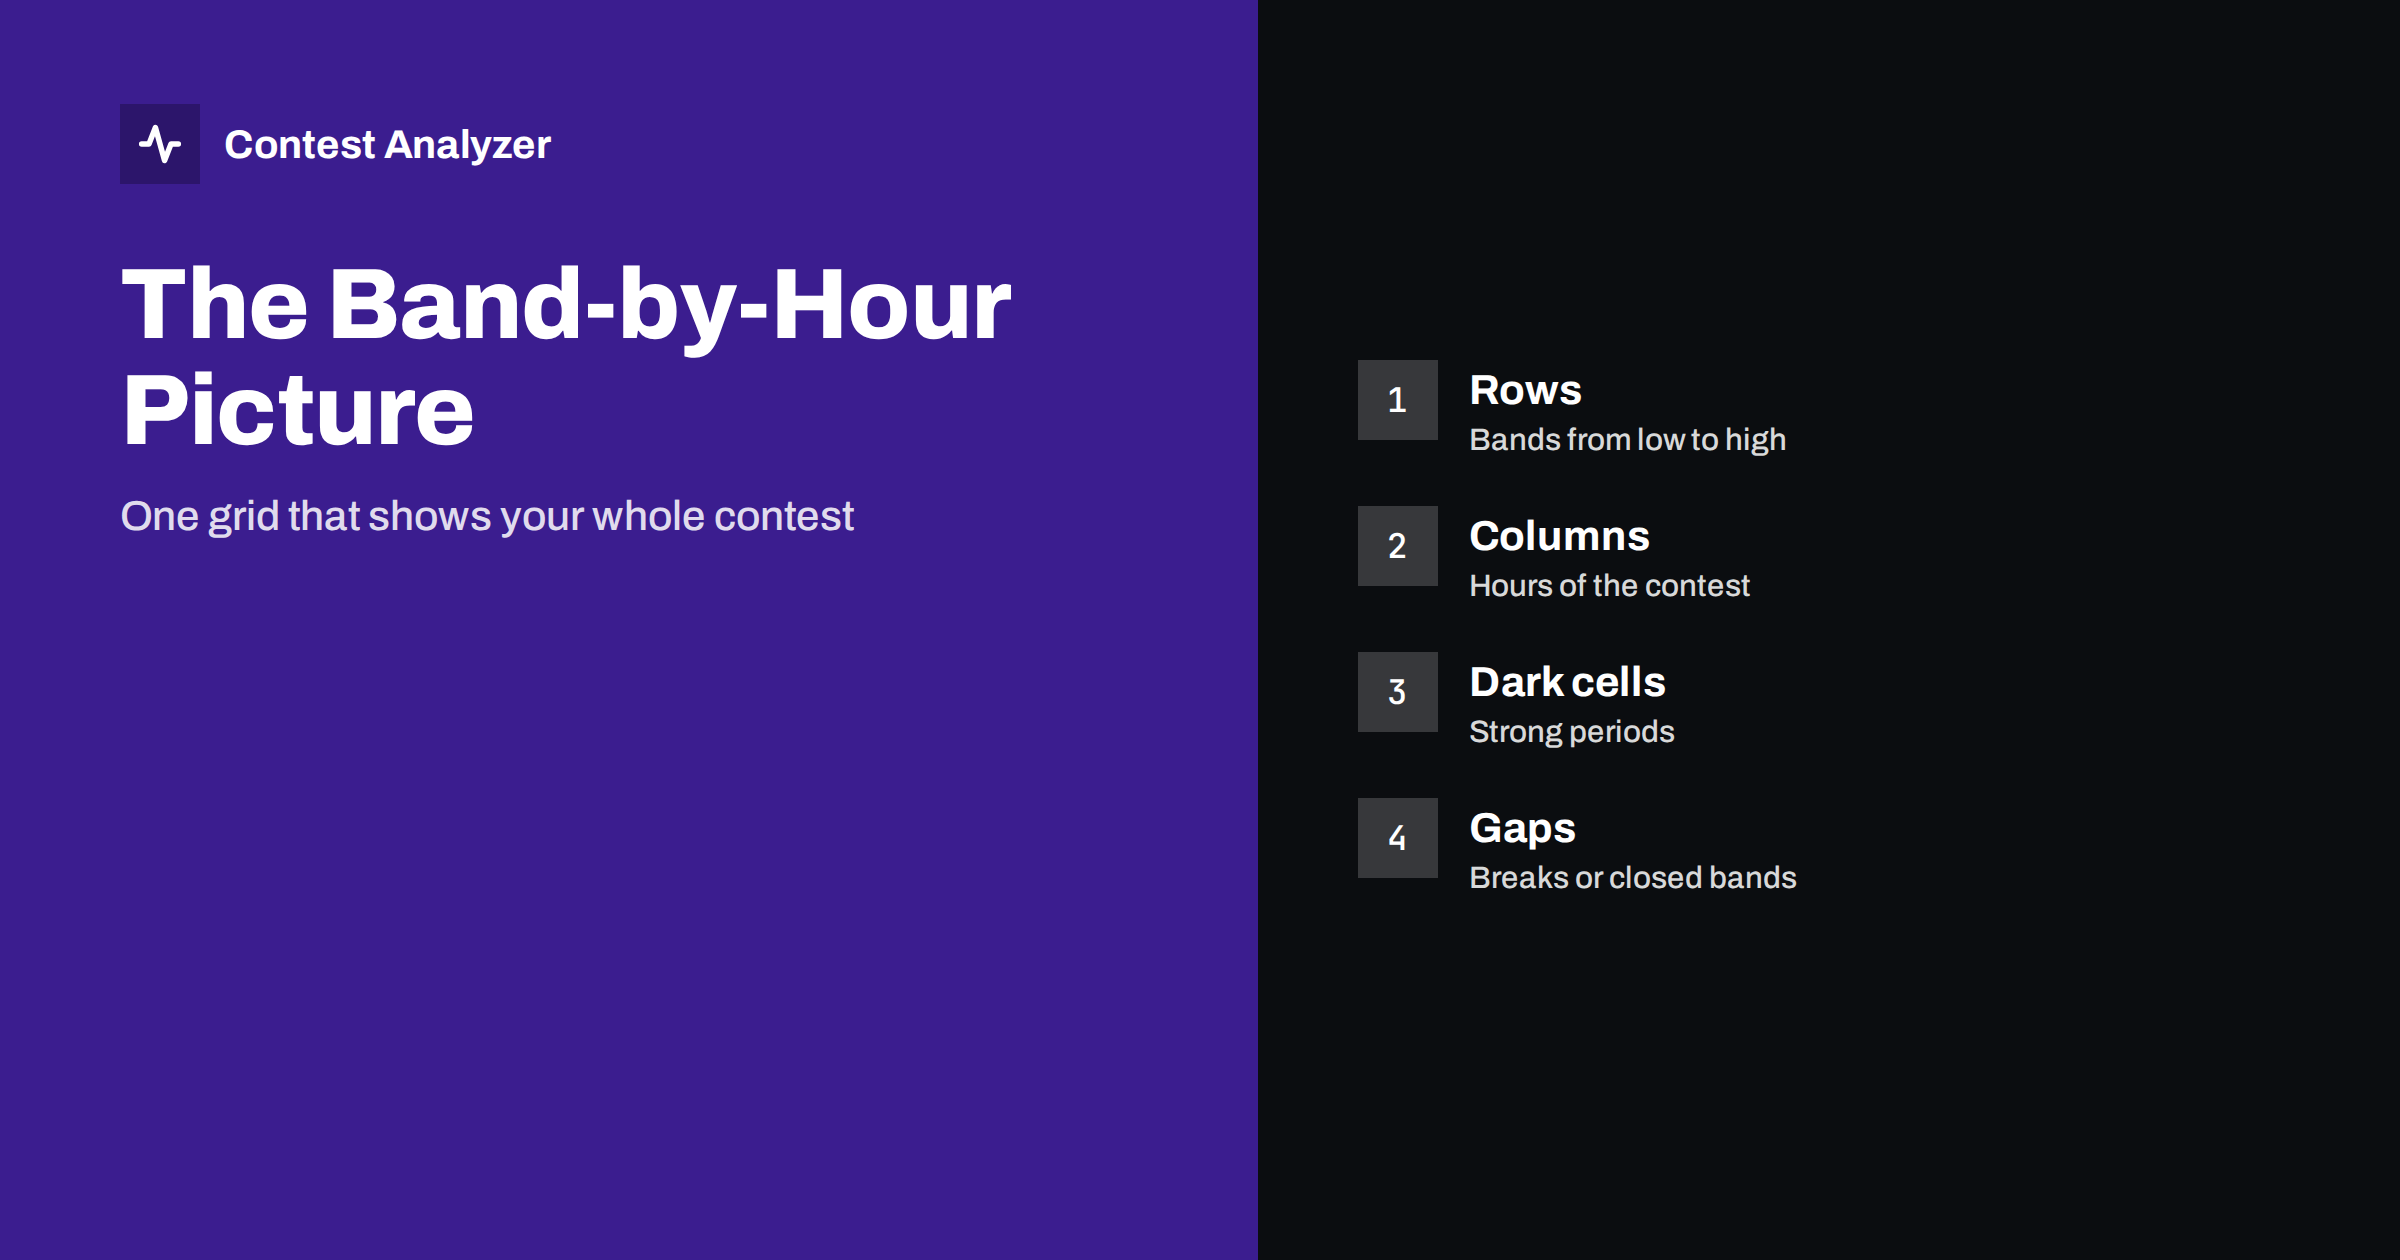
A normal list of QSOs by band and a normal list by hour each give you one dimension. The band-by-hour picture gives both at once. Each row is a band, usually ordered from the lowest to the highest frequency. Each column is one hour of the contest. Each cell holds the number of QSOs that you made on that band in that hour, and a strong colour or a large number marks a good period. Empty cells mark hours when you did not log anything on that band.
The result is a map of your contest. You can see the path that you took through the bands, the hours that you spent on each and how long the run lasted before the move. The picture is made from the log alone, and it shows facts. What the facts mean is up to you, and the following sections suggest how to read them. The article on hour-by-hour analysis gives the simpler version of the same idea.
First pass: the overall shape
Look at the whole picture without reading numbers. Where is the main mass? In a typical contest of 48 hours, the mass follows the sun: the high bands during daylight, the low bands in the night, and one or two strong bands in the middle. If your picture looks very different, find out why. Perhaps you stayed too long on one band when a better one was open, or an antenna problem prevented you from using a band at all.
Check the symmetry between the two days. If the second day looks like a weaker copy of the first, the bands were probably similar, and the loss comes from fatigue or from a smaller number of new stations. If the second day is very different, conditions changed, and you may find the reason in the solar data. The article on solar flux and contest results explains how to take this into account.
Second pass: the band transitions
Now look at the points where the main mass moves from one band to another. Each transition is a decision. You can ask three questions about it. Was it too early, so that the rate on the new band started lower than the rate on the old? Was it too late, so that the old band had already lost its callers? Did the rate on the new band quickly rise to the level of the old one? The article on band changes and rate shows a method to measure the effect.
The picture also shows the number of QSOs in the first hour on each band, which is often lower than in the later hours. This is normal, because you need time to find a frequency and to build a run. If the first hour is very weak on every band, you may be spending too long on search and pounce, or your new frequency selection may need to be improved.
Third pass: the gaps
Empty cells deserve a separate look. An empty column across all bands is a break, and you should be able to match it with your plan. An empty cell on one band at a time when you were on another is a sign that the band was not used. Was it closed, or did you not check? The article on openings to each continent hour by hour helps you to decide whether a band was really open.
Also look for short gaps inside a strong period. They may be caused by a technical problem, a pause for food or a long search for a multiplier. In the picture they appear as a light cell in the middle of dark cells, and they are easy to see. If they are many, look at what you did in those minutes.
What the picture says about propagation
The bands behave in typical ways, and the picture shows them. The low bands should be strong around the local night, the high bands in the day. The same band can be strong for a few hours with one continent and then with another. If you also have the continent breakdown, you can overlay the two. A band that was strong with Europe in the early hours and with North America later is a typical sign of a path that moves with the sun. The article on the continent breakdown shows how to read it.
Do not read too much into a single cell. A hole in the picture can mean propagation, but it can also mean that you were not there. Only a comparison with a log from another station nearby, or with your own log from another year, can separate the two causes. That is the reason why year-on-year comparison is so valuable.
An imagined example
To make the method concrete, imagine a picture with the following features. The 20 m row is dark from the early morning of the first day until the afternoon, then fades. The 40 m row has a dark block at the end of the first night and another in the second night. The 15 m row has a short dark period around midday on both days. The 80 m row has only a few light cells, and the 160 m row is empty. The highest band, 10 m, is empty on both days.
What can you learn from this? First, the plan followed the sun in the usual way, and the main bands were used where they were expected to be strong. Second, the 20 m block ended in the afternoon, and the next dark block started later on 40 m. Between them, there is a gap of two columns where the rate is low. Was it a planned break, or did you wait for the next band to open? This is a place to look for a better transition. Third, the low rows are almost empty. If your station has an antenna for them, you may have lost multipliers. If it does not, you know where an investment would help, and you can estimate the gain from the number of QSOs that you might expect.
Fourth, the empty 10 m row on both days can be the effect of the solar cycle, or of a decision to stay on the other bands. In the first case nothing could be done, and in the second you should check the openings in the log of another station. This kind of reasoning shows how the picture turns into questions, and how the questions turn into decisions. The same exercise with real data takes five minutes and gives you a list of actions for the next contest.
Remember that this example is imagined, and your own picture will be different. The method, however, is always the same: look at the shape, at the transitions and at the gaps, and write a question for each.
Questions to ask before the next contest
- Which band gave the most QSOs in the best hours, and can I be there earlier next time?
- Which hours were weak on every band, and was it conditions or my plan?
- Which band did I use least, and was it a decision or a lack of attention?
- Where did the first hour on a new band fall far below the later hours?
- Which breaks cost most, and could they be placed in a weaker period?
Write the answers in your notebook, with the year. When you read them again before the next contest, they give you a plan based on your own data.
Making the picture with your own tools
You can make a band-by-hour table with a spreadsheet, by counting the QSOs for each combination of band and hour, and colouring the cells. A report from a tool does the same without the work, and shows the picture next to the other statistics. Contest Analyzer gives rates, QSOs by hour and band, countries, continents, CQ and ITU zones, WPX prefixes, distance, beam heading, breaks and off time, and callsign length and structure. It supports year-on-year comparison with your own logs, so you can put two years side by side. It checks every callsign and every zone against official license databases and several independent reference sources and shows only the few QSOs worth a second look. See the contests page for the supported contests and the pricing page for plans.
Related reading
The bottom line
A band-by-hour picture shows your contest in one view. Read the shape, the transitions and the gaps, ask a few clear questions and use the answers to plan the next contest.
FAQ
What does a dark cell mean?
A period with many QSOs on that band in that hour, which is usually a strong run.
Can I make this picture without special software?
Yes, with a spreadsheet that counts QSOs per band and hour, but a report does it automatically.
Does an empty cell mean the band was closed?
Not necessarily. It may mean that you were on another band, so check your notes.
How is this different from a simple hourly chart?
The hourly chart shows the rate only. The picture also shows on which band each hour was spent.
Which years should I compare?
The same contest in different years, noting the changes in conditions and in your station.