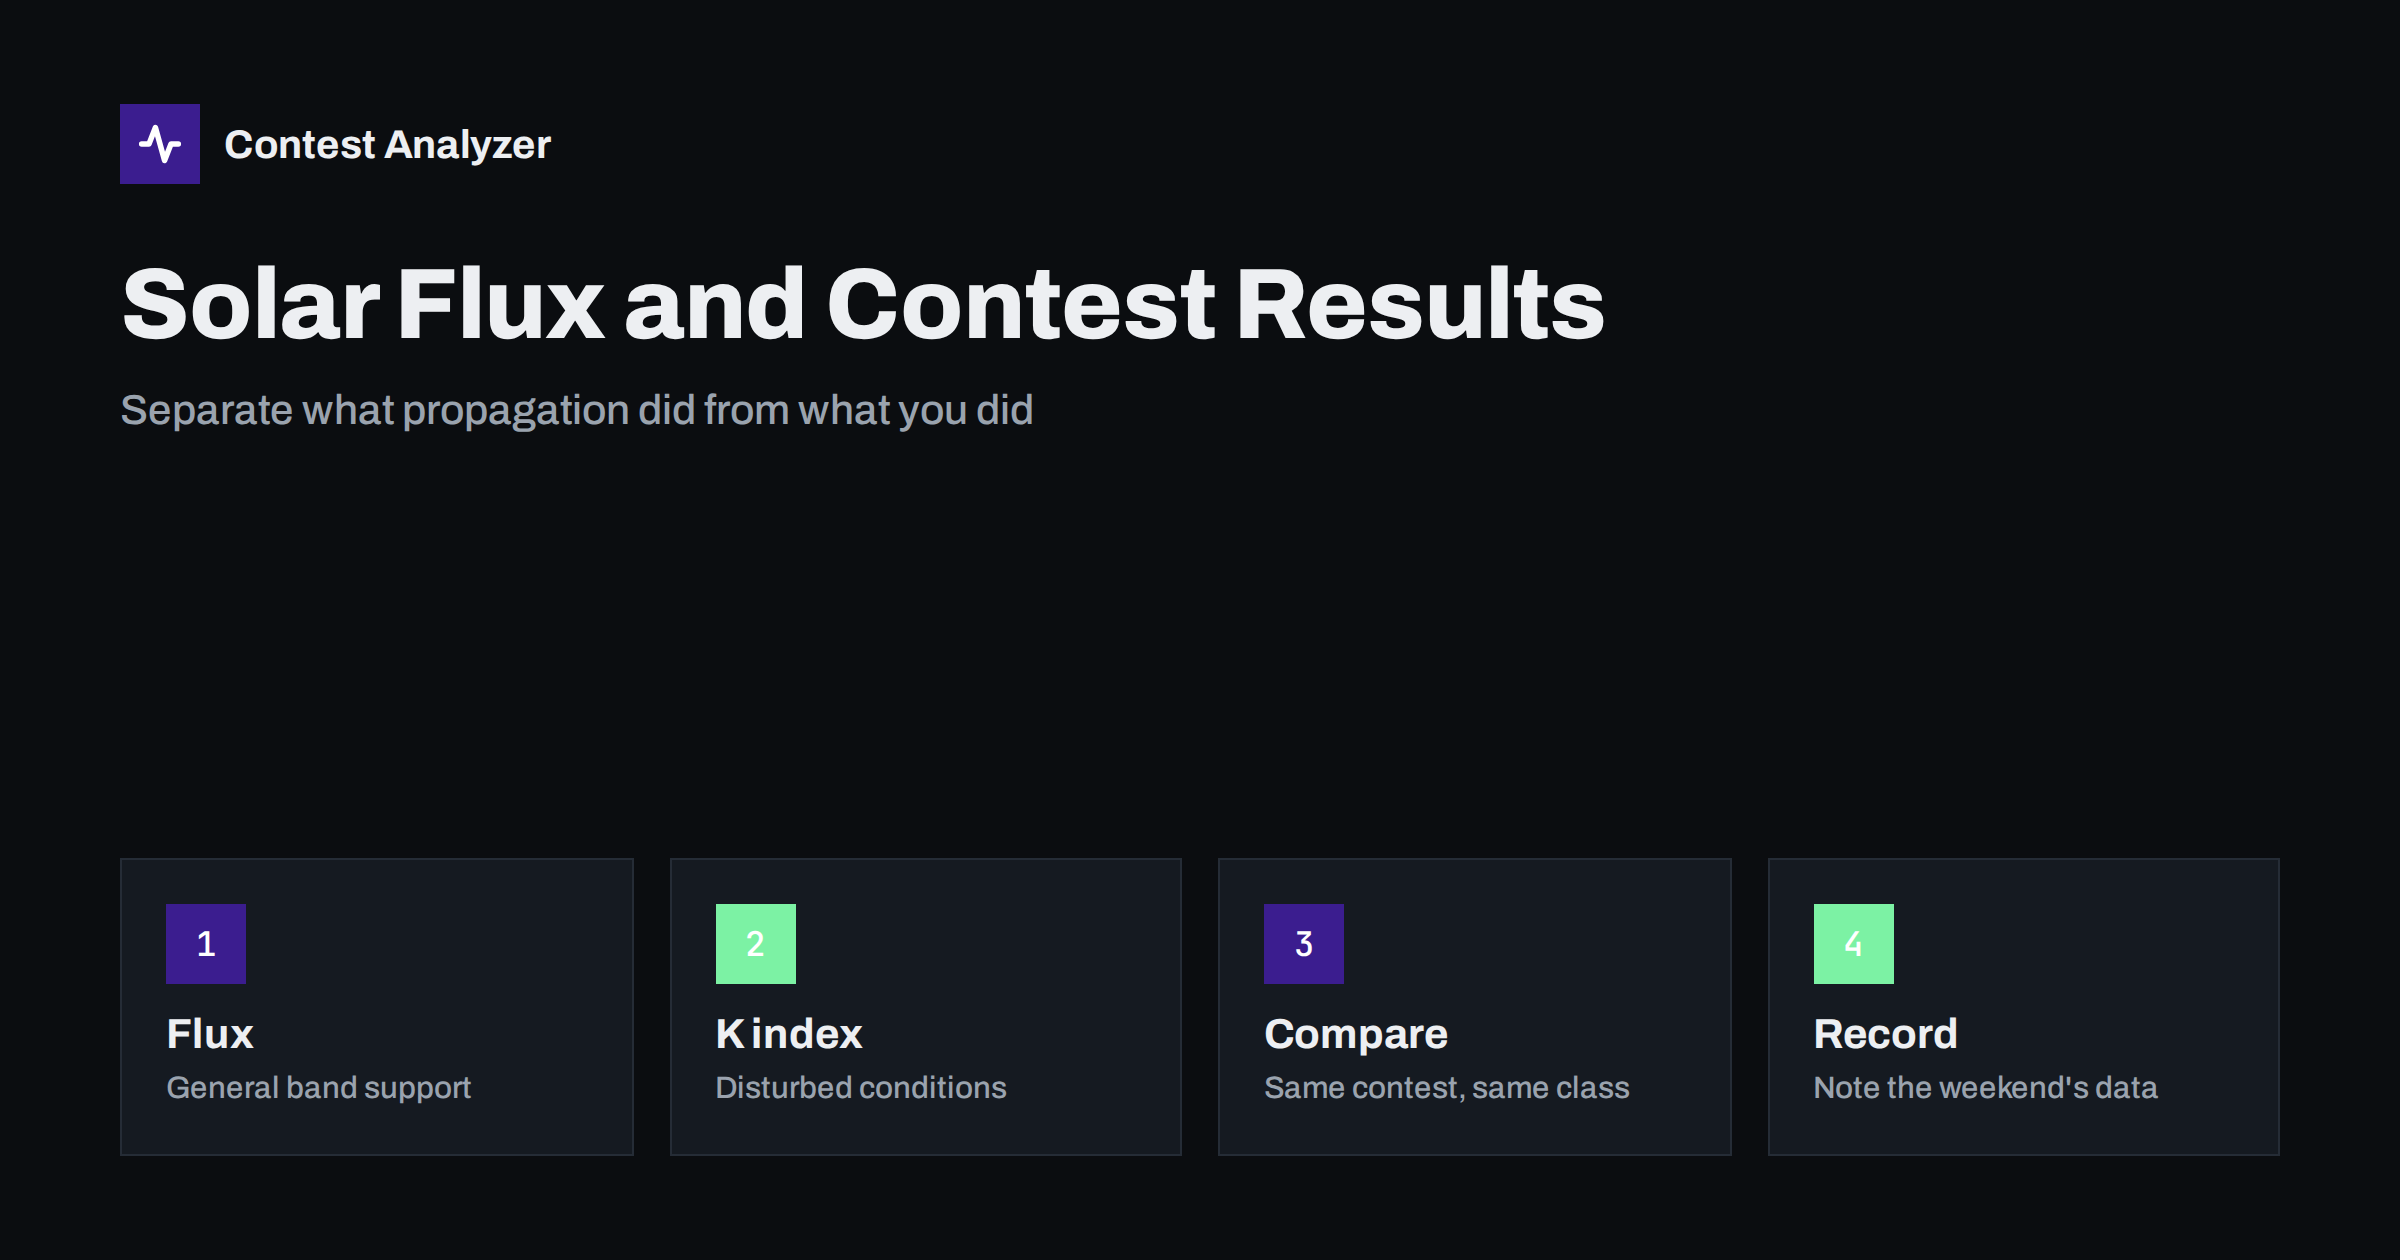
Short answer: Solar activity and geomagnetic conditions are among the biggest reasons why a contest result moves from one year to the next, even when your station and your effort stay the same. The solar flux gives a rough idea of how well the higher bands may work, and the K index warns of disturbed conditions. To compare years fairly, note the conditions of each contest weekend, compare the same contest, mode and category, and look at band-by-band rates and shares, not only at the final score.
Why a good operator can still have a worse year
Every contester has experienced it. You prepared better, the antennas were improved, you operated more hours, and the score was lower than the year before. The reason is often not in the station at all but in the ionosphere. HF propagation depends on the sun, and the sun changes on timescales from minutes to years. A cycle of solar activity takes roughly eleven years, and within that cycle conditions vary from month to month and from day to day.
This has a practical consequence for how you read your own results. A drop in total QSOs or multipliers needs an explanation before it becomes a conclusion. If you decide that your new antenna is worse because the score fell, you may be wrong. If you decide that a good score proves your new strategy worked, you may be wrong in the other direction. Propagation is the variable that you cannot control, and the sensible approach is to measure it, note it and take it out of the comparison as far as possible.
The indicators in plain words
Three numbers are used again and again in discussions about conditions. Their values come from public sources such as the NOAA Space Weather Prediction Center. We describe what they mean in general and leave the thresholds to the sources.
- Solar flux index (SFI). A measure of solar radio emission at a wavelength of 10.7 centimeters. It is widely used as a simple indicator of solar activity. In general terms, a higher flux goes with stronger ionization of the upper atmosphere, which tends to support the higher HF bands for longer parts of the day, while a lower flux tends to leave the higher bands quiet and favor the lower bands.
- K index. A scale from 0 to 9 that describes how disturbed the Earth’s magnetic field is over a three-hour period. Low values mean quiet conditions. High values point to a geomagnetic disturbance, which can weaken or break paths, especially those that cross high latitudes.
- A index. A daily summary of geomagnetic activity, related to the K values. It is useful for judging a whole day, where the K index shows how conditions moved within it.
These numbers are indicators and not forecasts of your result. The same flux value can produce different conditions on different paths and at different times of day, and local noise, antennas and operator skill still matter. Think of them as context, much like weather for a sailing race.
What propagation does to a contest log
The effect appears in several places in your statistics, and recognizing them helps you tell conditions from decisions.
- The balance between bands. In a year with good support for the high bands, a larger share of QSOs comes from 15 and 10 meters and the day-time blocks are longer. In a quieter year, the share moves toward 20, 40 and 80 meters, and the night hours become more important.
- The reach of your signal. Continents and countries that were easy in one year may be missing in another. A change in the continent breakdown can be a sign of conditions, not of antenna problems.
- The multipliers. Fewer open bands usually means fewer chances for zones and countries per band. The multiplier count can fall faster than the QSO count.
- The rate profile. A disturbed weekend may show a strong start followed by a collapse, or an unusually flat rate. Compare the hour-by-hour shape with previous years before you look for a technical cause.
- The effect on activity. When conditions are poor, many stations are less active or give up early, so even a perfect signal finds fewer partners.
None of this means that the results are out of your hands. It means you should read the numbers in layers: first what conditions allowed, then what you did with them.
Record the weekend, then compare
The simplest way to make years comparable is to write down the conditions at the time. It takes five minutes after the contest and saves guessing a year later.
- Note the solar flux for the contest days. Take it from a public archive or from your own notes, and write the dates next to it.
- Note the K or A index for the weekend, and mark any hours with disturbed conditions that you remember.
- Add your own remarks: which bands felt good, which felt dead, when you noticed noise or fading.
- Keep these notes with the log and its report, using the same layout every year.
Do not invent numbers afterwards. If you did not record them, look them up in a public archive for the exact days, or leave the field empty. A note that says “no data” is more honest than a guess.
How to compare years fairly
With the conditions noted, you can set up a comparison that does not punish or flatter you for things you did not control. Our article on comparing contest results year on year explains the basic list of figures. Add these points for propagation:
- Compare like with like. Same contest, same mode, same category, same operating hours. A comparison between a 24-hour entry and a 48-hour entry tells you little.
- Compare QSOs per hour, not only totals. If you operated different numbers of hours, the rate corrects for it.
- Compare band by band. A fall on 10 meters together with a rise on 40 meters can be a shift in conditions, with the total almost unchanged.
- Compare shares as well as counts. The percentage of QSOs on each band and from each continent shows the shape of the contest without depending on the total.
- Compare your result with others in your class if you can. Published results of stations of a similar level show whether your change followed the general trend or was specific to you.
- Change one thing at a time. If you change antennas, location and operating schedule together, no comparison will tell you which one helped.
A useful rule is to look for changes that go against the conditions. If conditions were worse and your score was the same or better, something you did worked. If conditions were better and your score fell, look at your own decisions more closely.
Where Contest Analyzer fits in
The statistics you need for this comparison are exactly those that Contest Analyzer produces from a Cabrillo file: rates, QSOs by hour and band, countries, continents, CQ and ITU zones, WPX prefixes, distance, beam heading, breaks and off time, and callsign length and structure. The year-on-year comparison with your own earlier logs puts the same numbers side by side, so a shift between bands or continents is visible immediately. The report does not know the solar data, so keep your own notes on conditions next to it.
The same upload also checks every callsign and every zone against official license databases and several independent reference sources and shows only the few QSOs worth a second look. You can correct calls and zones in the report and download a corrected Cabrillo. This matters for comparison, because uncorrected errors in one year and not in another make the numbers harder to compare. The service supports Cabrillo from N1MM Logger+, DXLog and Win-Test and covers 22 contests; serial numbers are not checked and dupes are not errors. See the contests page for the list.
What not to conclude
Be careful with a few tempting conclusions. A good solar year does not guarantee a good result, since many stations benefit equally and the competition rises. A poor year does not prove that your station is weak. A single contest is a small sample, so one result should never settle a question about an antenna or a strategy. And conditions are only one of several effects: activity, your health and fatigue, local noise and equipment faults all play a role. Treat propagation as one important column in a longer table.
Related reading
The bottom line
Propagation changes results, and you cannot change propagation. You can record it, compare like with like and read your statistics in layers, from conditions to decisions. Do that, and a lower score in a poor year becomes useful information instead of a reason to doubt your station.
FAQ
What is the solar flux index?
It is a measure of solar radio emission at 10.7 centimeters, used as a simple indicator of solar activity. Generally, higher values go with better support for the higher HF bands.
What does a high K index mean for a contest?
It points to a disturbed geomagnetic field, which can weaken paths, especially those crossing high latitudes. Conditions can change within a few hours.
Where can I find the data for a past contest weekend?
Public space weather services keep archives of flux and geomagnetic indices. Note the exact dates of the contest and look them up there.
Can I compare my score with a year of different conditions?
Yes, but compare rates, band shares and continents, not only the total, and note the conditions. Changes that go against the conditions are the most informative.
Does a better flux always mean a higher score?
No. It improves the chances on the higher bands, but activity, your station and your decisions still decide the result.