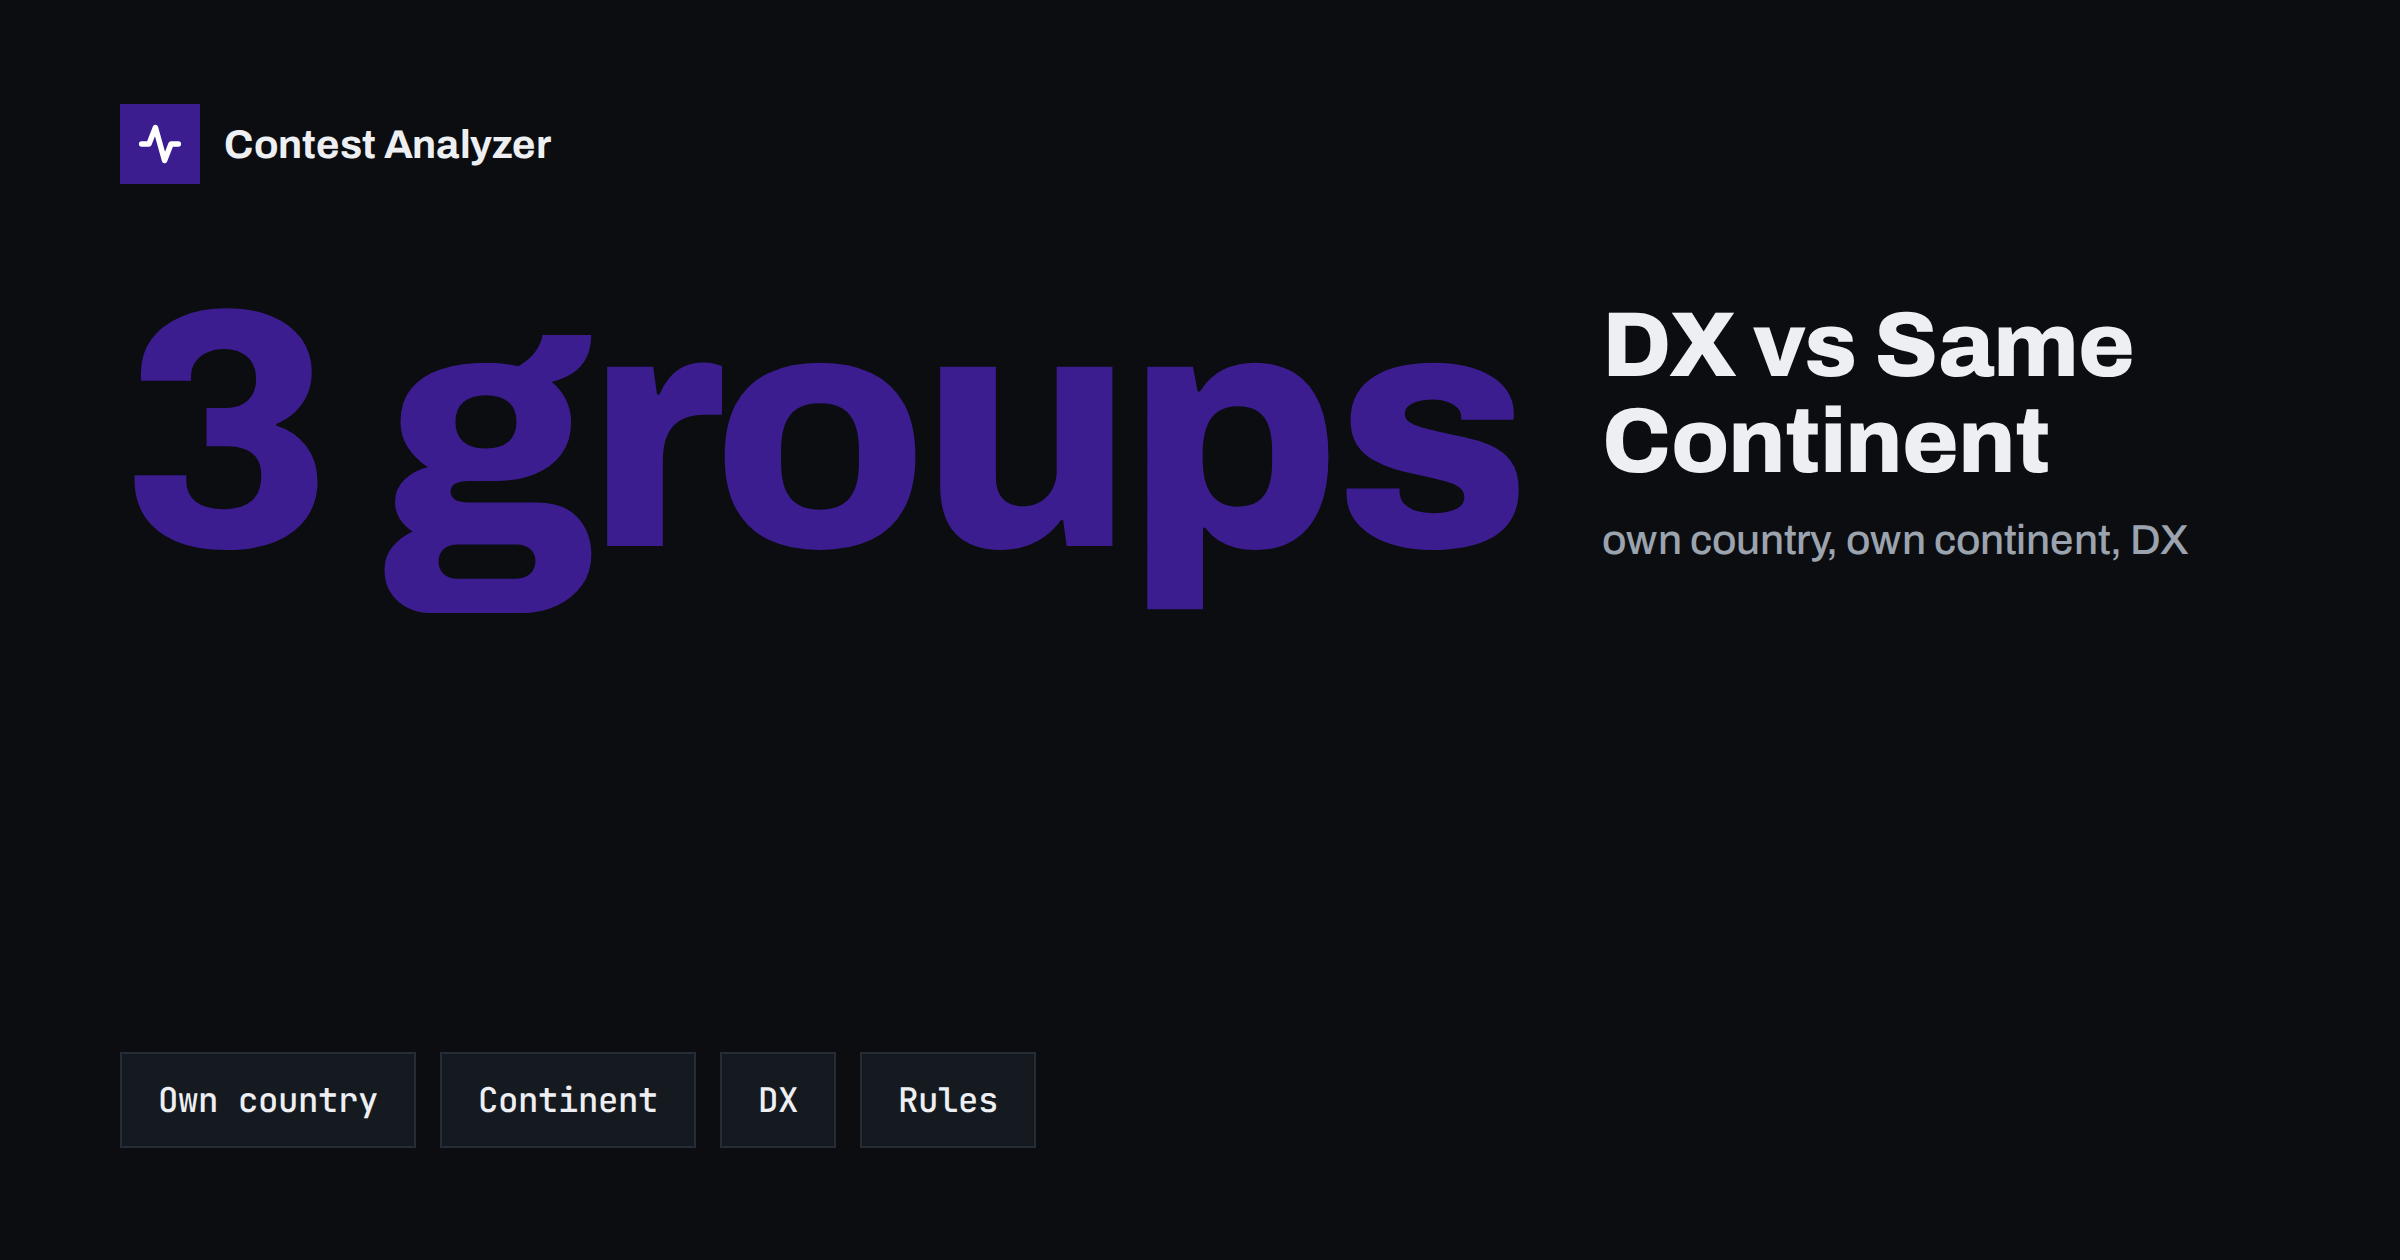
Short answer: Your QSOs fall naturally into three groups: stations in your own country, stations on your own continent and stations on other continents. In many contests the group decides how much a QSO is worth, and in all contests it says something about your station, your timing and the propagation. The share of each group is one of the easiest ways to see whether the contest was spent on easy contacts or on valuable ones. Always read the point values from the official rules of the contest, since they differ and can change.
Three groups, one question
The question behind the split is simple: where did my QSOs come from? A station in the middle of Europe, for instance, has hundreds of other stations that can be reached on short paths even with a modest antenna, and a long list of stations on other continents that are reachable only when the bands are open and the antennas are good. The same is true, in a different pattern, for every other part of the world. The statistics by continent and country in your report tell you the shares, and the distance and beam heading figures show how far and in which direction your contacts were.
Seen as a ratio, the split resembles the share of QSOs per band, but it asks a different question. The share per band is about your time and your station. The continent split is about the type of contacts that filled the log, and it can be read hour by hour in the same way as the band figures, as described in the article on hour-by-hour analysis. A table with hours down the side and the three groups across the top is often the clearest picture of how the contest developed.
How the groups are usually valued
Whether a contact with one group is worth more than with another depends entirely on the rules. In some contests, every QSO counts the same, and the split is only a matter of interest. In others, such as the CQ WW contests, the points depend on whether the other station is in the same country, on the same continent or on a different one, and there may be special rules for particular continents. The article on QSO points in CQ WW explains the pattern and links to the official rules.
It is better not to carry point values in your head from one contest to another. Before you analyse the split, find the rule that applies to that contest and year and write the values next to your numbers. If the contest awards no points for contacts within your own country, as some do, then a log that has many of them has a low average value per QSO even if the rate was high. In contests where only DX contacts count, a QSO with a neighbour may be a valid contact that earns nothing. In some contests, the contacts within the home group are the whole point. The rules decide.
What a high same-continent share tells you
A large share of same-continent QSOs is normal for many stations, and it is not a fault. It tells you that the near stations were easy to work, that the rate in those hours was probably high and that your station was very effective on short paths. It can also mean that the bands were not open to other continents for long, or that the antennas were not pointed where the DX was.
The points to examine are these:
- In which hours was the same-continent share highest? It is often at the start and the end of band openings, when the long paths are not yet open or have closed.
- Was the rate in these hours high enough to compensate for the lower value of each QSO, if the rules distinguish them? A high rate of low-value contacts can beat a low rate of high-value ones, or the opposite, depending on the numbers in the rules.
- Did you miss time on other continents because you were running on a good frequency and did not tune across the band?
What a high DX share tells you
A large share of contacts with other continents usually points to a good station for long paths, good timing or a favourable location. It may also reflect a decision to search for DX stations actively. If your rate was lower in those hours, the conclusion is not necessarily that it was a mistake. If each contact was worth more, the final result may be better. The right comparison is between points per hour, not QSOs per hour, under the current rules.
You may also see that the DX share is concentrated in certain hours and certain bands. That is expected: the long paths open at particular times. The article on the continent breakdown of a contest log shows how to look at it by continent, and beam heading and distance statistics shows how to see which directions delivered the QSOs.
What the split says about antennas and timing
A single number is not enough, but combined with the other statistics, the split can answer practical questions.
- Is my antenna favouring one direction? If almost all the DX came from one direction, the beam heading statistics will show it. Think about whether the pattern comes from propagation or from the antenna.
- Am I missing a continent? If one of the continents that is normally reachable for you is almost absent, check the hours when it should have been open. Was the antenna pointed elsewhere, or were you on a different band?
- Did I use the best hours for DX? If your best DX hours were also the hours when you were away from the radio, or running on a frequency without DX callers, you may have lost valuable QSOs.
- Is the near-station share too high at night? Low bands at night often bring near and far stations together, and which of them you choose is a decision.
Always keep conditions in mind. A year with poor propagation will shift the split towards near stations, whatever you do. The article on solar flux and contest results helps to separate conditions from choices.
Your own country in the split
The home-country group is easy to ignore and sometimes more interesting than it seems. In a country with several zones or in a contest that counts multipliers within the home country, contacts at home can supply multipliers even when they add little to the points. In other cases, they are simply the quickest way to fill the log in a quiet hour. If the rules make your own country worth nothing in points, a long run of home callers is a sign that your frequency is busy but not productive. If they are valuable as multipliers, then every new one counts. See the article on multiplier strategy in CQ WW for how to think about this.
A practical way to read it after the contest
Start with the three shares and write the point or multiplier value of each group next to them, taken from the current rules. Then look at the hours. In which hours did the DX share peak, and what was your rate then? In which hours was the same-continent share highest, and was that because the long paths were closed or because you were not looking for them? Finally, list one change that would move the split in the direction you want, for example a better antenna for one direction, an earlier start on a band or a more regular tune through the band between runs. A single, concrete change is more useful than a long list of observations.
Reading the split year on year
The split becomes more meaningful when you compare it with earlier logs. A shift towards more DX, with a similar total, suggests that you spent more time on long paths, or that conditions improved. A shift towards the near group suggests the opposite. Combine this with the rate and the band ratio, and you will see whether a change in result came from the type of contacts or from their number.
Contest Analyzer shows the figures you need: full statistics by continent, country, CQ and ITU zone, WPX prefix, distance and beam heading, with rates and QSOs by hour and band, and a comparison with your own logs from earlier years. It checks every callsign and every zone against official license databases and several independent reference sources and shows only the few QSOs worth a second look, so that the statistics are based on a corrected log. You can edit calls or zones in the report and download a corrected Cabrillo. It works with Cabrillo from N1MM Logger+, DXLog and Win-Test; the contest list shows the 22 contests covered.
Related reading
The bottom line
The split between your own country, your own continent and the DX is a simple table that raises useful questions. What was each group worth under the rules, in which hours did each one come, and was the balance a choice or a result of conditions? Check the official rules for the values, compare the shares with your earlier logs and use the answer to plan the next contest: more time where the value was, and no regrets about the near stations that kept the rate alive.
FAQ
Are DX QSOs always worth more?
Not in every contest. Some contests value all QSOs equally, others by distance or group. Check the current rules.
Is a high same-continent share bad?
No. It may reflect a strong short-path station or poor conditions to other continents. Judge it by points and rate per hour under the rules.
Where can I see the split in my log?
The continent and country statistics in the report show it, and the distance and beam heading figures add the direction of your contacts.
Should I stop working near stations?
Not usually. They keep the rate up and may provide multipliers. Use the hours when DX is open for the long paths.
How do I compare two years fairly?
Use contests with the same rules and consider propagation. Compare shares and points per hour, not only totals.