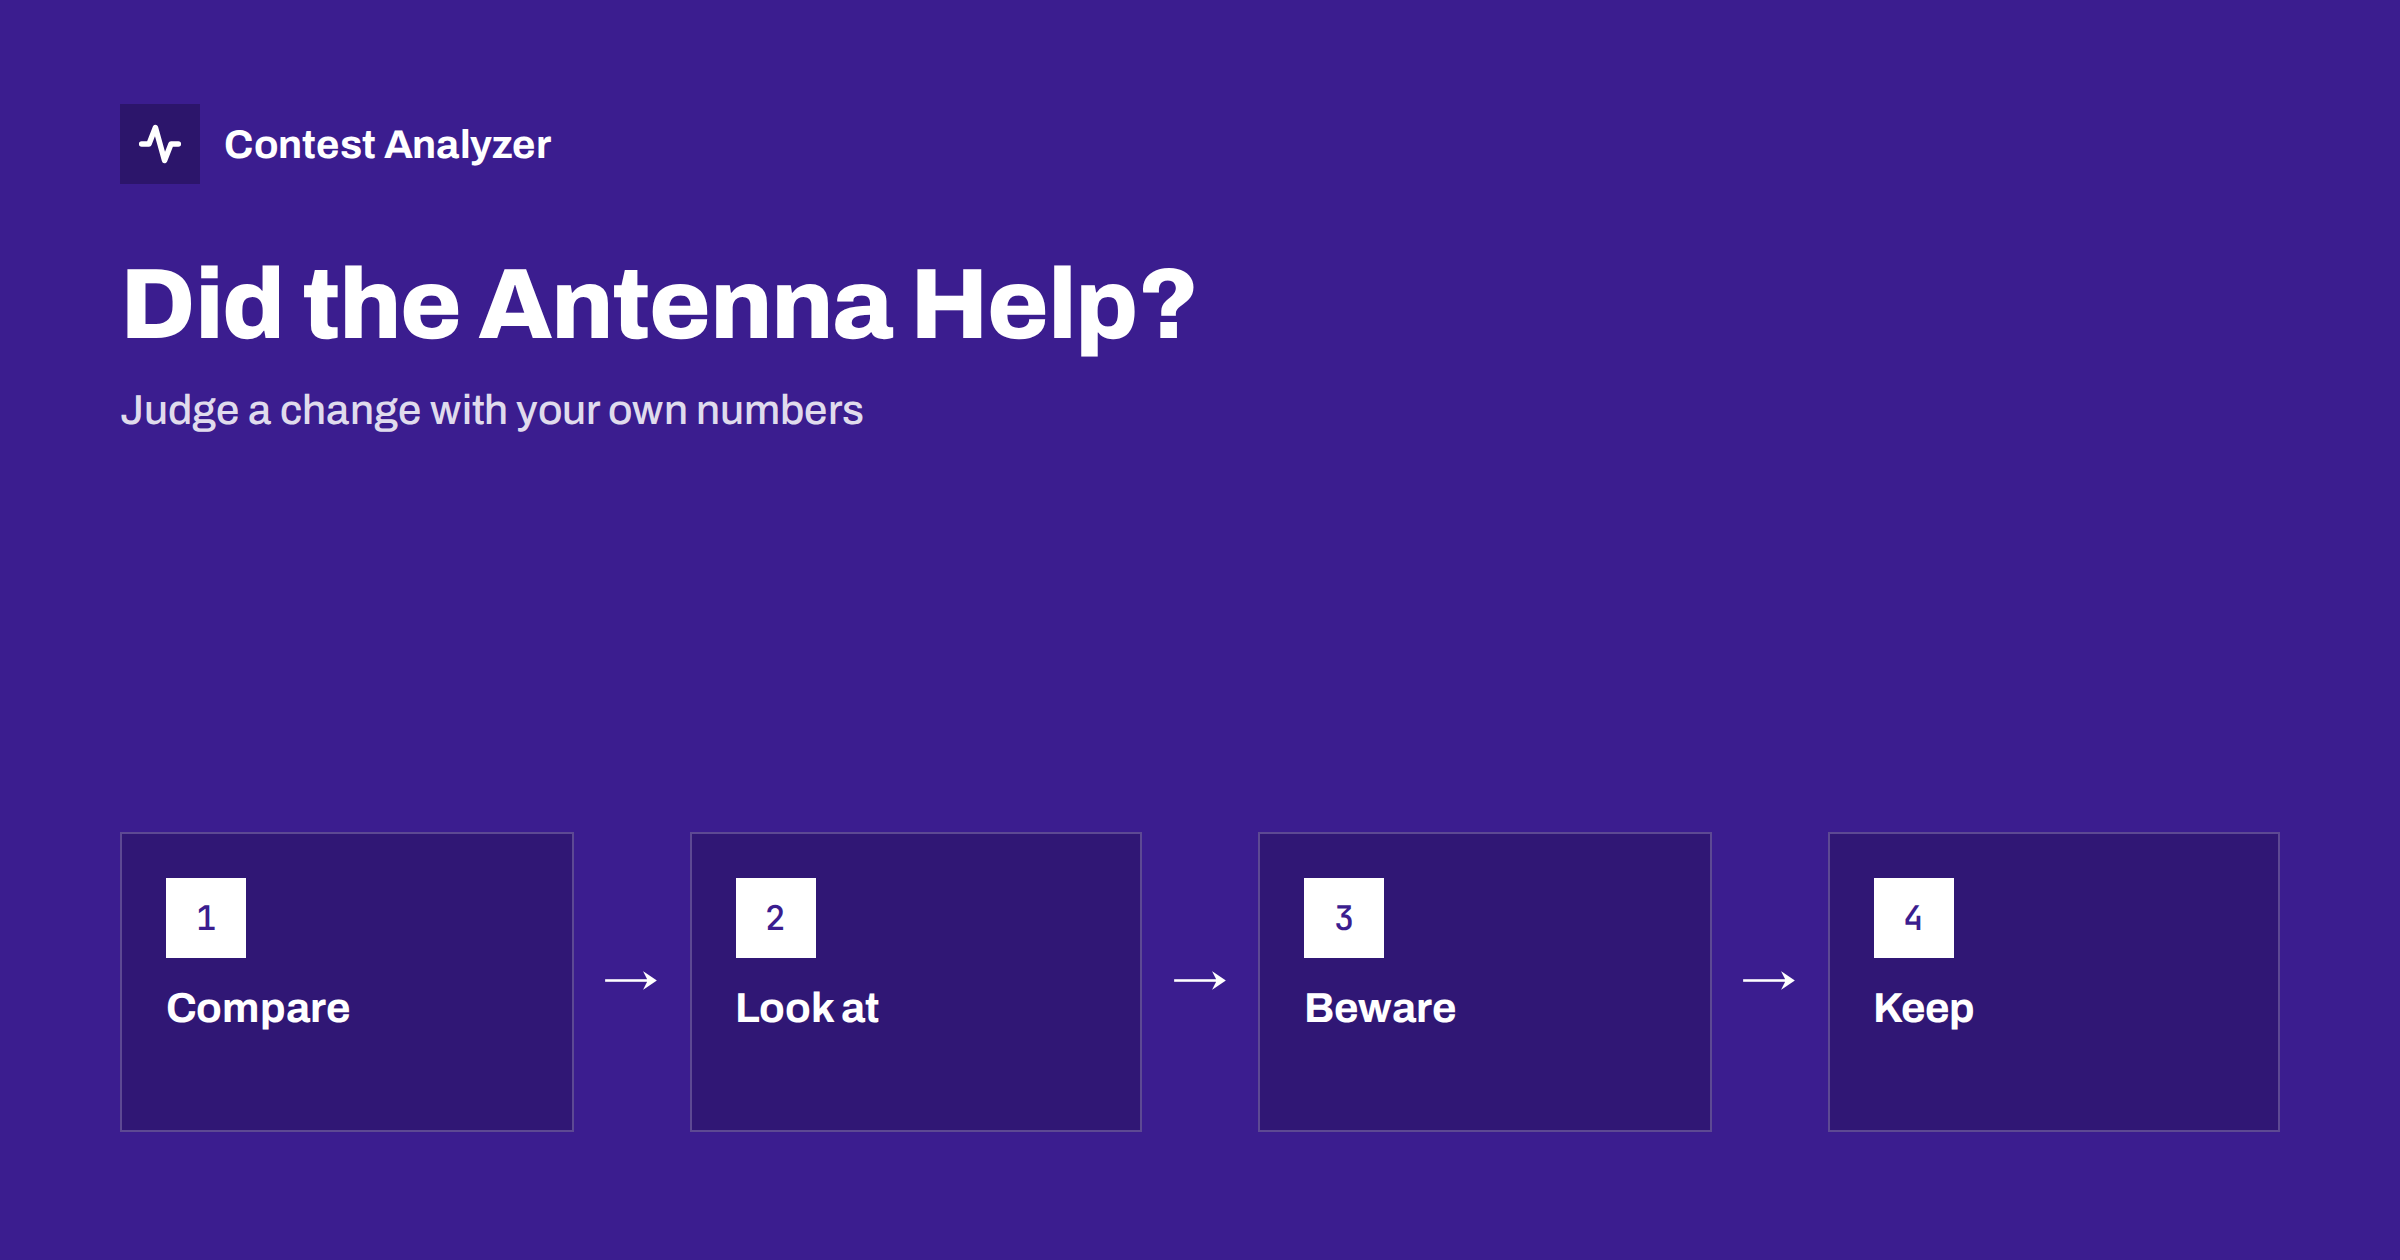
Short answer: A contest log is a good measuring tool for an antenna change, if you use it with care. Compare the same contest in different years, look at QSOs by band, by continent and by beam heading, and at the distance of the contacts. Do not judge from a single weekend, because propagation, activity and your own operating change from year to year. Write down every change you make at the station, so that the numbers can be explained later.
Why the log is better than a feeling
After you raise a new antenna, you usually feel that it works better. The stations seem louder, the pile-ups are easier, and the first impression is often positive. A feeling is not wrong, but it is also not a measurement. During a contest, you remember the best moments, such as a rare multiplier on the first call, and forget the hours in which nothing happened.
The log has none of these weaknesses. It records every QSO with the time, the band and the callsign, and from those three things the statistics can tell you how many QSOs you made on each band, which continents you reached and how far the signals travelled. When you have a few years of such logs, you can put one beside the other and see whether the change shows up in the numbers.
What to compare
An antenna changes some things and leaves others unchanged. A new beam for 20 metres will affect the QSOs on that band, and probably not the QSOs on 160 metres. For this reason it is better to compare the numbers on the band you changed than the total score, which also depends on everything else. These are the main figures to look at:
- QSOs by band. Did the number of QSOs on the band rise or fall relative to the other bands?
- QSOs by continent. Does the new antenna reach directions that were weak before? Check the share of each continent and not only the totals.
- Beam heading. If your statistics show the heading of the QSOs, you can see whether the new antenna is used in the directions you hoped for.
- Distance. The longest QSOs and the average distance per band can show a difference in reach.
- Rate on the band. If the QSOs per hour on the band changed, take into account how many hours you spent on it.
See continent breakdown of a contest log and beam heading and distance statistics for more help with reading these figures.
Compare the same contest
The most important rule is to compare like with like. A CQ WW DX log should be compared with an earlier CQ WW DX log from the same mode, not with a regional contest or with another mode. The activity, the participants and the exchange are different, and so are the bands that give the best results. Even the same contest in a different year is not a perfect twin, but it is close enough to give useful information, particularly when you compare the shares and the ratios and not only the absolute numbers.
The article on comparing contest results between years describes what to include in the comparison, and reading the band ratio shows how to use the proportions between bands instead of raw numbers, which is a good method when activity is different between the years.
What can spoil the comparison
There are several factors that are not connected with the antenna but change the numbers. The more of them you know, the better your conclusion.
- Propagation. Solar activity changes the bands that are open and the strength of signals. The article on solar flux and contest results explains how to compare years fairly.
- Operating time. If you were on the band for ten hours one year and five hours the next, the totals will differ. Compare QSOs per hour on the band and not only the totals.
- Category and effort. A different category, a break at a different time or a change of operator affects the result. See assisted and unassisted categories if the category changed.
- Activity of others. Some years more stations take part, and some years fewer. The share of continents may change simply because activity in one region changed.
- Logging style. Run and search and pounce give different numbers. See run versus search and pounce.
A simple method
Take a sheet or a small table for each contest and fill in the same lines every year: the QSOs on the band, the QSOs per hour on the band, the share of each continent, the longest distance and the average distance. After a change of antenna, add a line with the date and a short description. When the next contest is over, add a new column. In three or four years, the table will tell you much more than a memory.
When the change is large, such as a new tower or a new type of antenna, the effect often shows up on the first contest. When it is small, such as a different height or a different feed, the effect may be hidden by the noise from propagation and activity. In that case, do not draw a conclusion after a single weekend. A better method is to wait for the second or third contest, and in the meantime to make direct comparisons on the air, such as comparing signal reports from the same stations with two antennas, if your station allows it.
Using the review as the source of the numbers
Statistics need a clean log. A busted call or a wrong zone will slightly distort the continents and the countries. Contest Analyzer checks every callsign and every zone against official license databases and several independent reference sources and shows only the few QSOs worth a second look. After you correct them, the report gives full statistics, with rates, QSOs by hour and band, countries, continents, CQ and ITU zones, WPX prefixes, distance, beam heading, breaks and off time and callsign length and structure. You can edit calls or zones in the report, download a corrected Cabrillo and compare the result with your own logs from earlier years. It works with Cabrillo from N1MM Logger+, DXLog and Win-Test, and supports 22 contests, listed on the contests page. Serial numbers are not checked and dupes are not errors.
Keep a record of the changes
The numbers mean little if you cannot remember what you changed. Keep a short record of everything that is different from one contest to the next: the antennas and their heights, the amplifier, the cables, the operators and the software. A few lines after each contest are enough. With such a record, a drop or a rise in the statistics can be matched with a real cause.
An example of reading the numbers
Imagine that you replaced a simple wire antenna for 15 metres with a beam. In the following contest, the share of your QSOs on 15 metres is higher than before, and more of them are with Asia and North America, directions that were weak with the wire. The average distance on the band is longer, and the rate per hour on 15 metres is better, although you were there for about the same time. Each of these indicators alone could have another explanation, but together they tell a consistent story. Now imagine the opposite: the number of QSOs on the band has fallen, but the cause is that the band was poor in that year and that you spent fewer hours on it. The rate per hour on the band, compared with the other bands in the same contest, will probably show the truth. Always ask what else could explain the number before you give the credit or the blame to the antenna.
The same approach works for a change of amplifier, a new receive antenna, a different location of the beam or a new feed line. The question is always the same: on which band and in which direction should the effect appear, and does it?
What a good result looks like
Do not expect a change to show up as a higher total score, because the score depends on many things. A realistic sign of improvement is a shift in the shape of the numbers: a higher share of QSOs on the band you changed, more contacts in the direction you wanted to reach, a greater average distance or a better rate on the band for the same hours. If two or three of these indicators point in the same direction in more than one contest, you have a good reason to believe the change worked. If none of them moved, the change may still be useful for other reasons, such as noise or reliability, but it did not change the reach in a way the log can show.
Related reading
- Comparing contest results between years
- Beam heading and distance statistics
- Continent breakdown of a contest log
The bottom line
Your own logs are the best evidence of what an antenna does. Compare the same contest from different years, concentrate on the band you changed, look at the continents, the headings and the distance, and keep in mind propagation and activity. Be patient with the conclusion, and write down every change, so that the numbers can be explained.
FAQ
Can one contest prove that an antenna is better?
Rarely. Propagation and activity change each year, so look for the same trend in two or three contests.
Which numbers are the most useful?
QSOs and rate on the band you changed, the share of continents, beam heading and distance are the most informative.
Should I compare total scores?
Total scores depend on too many things. Compare the figures on the affected band instead.
What if I changed the category?
Then the comparison is weaker. Compare the shares and the ratios, not absolute numbers, and say so in your notes.
Do I need a corrected log for this?
It helps, because wrong calls and zones distort the continents and countries. Review the log before you read the statistics.