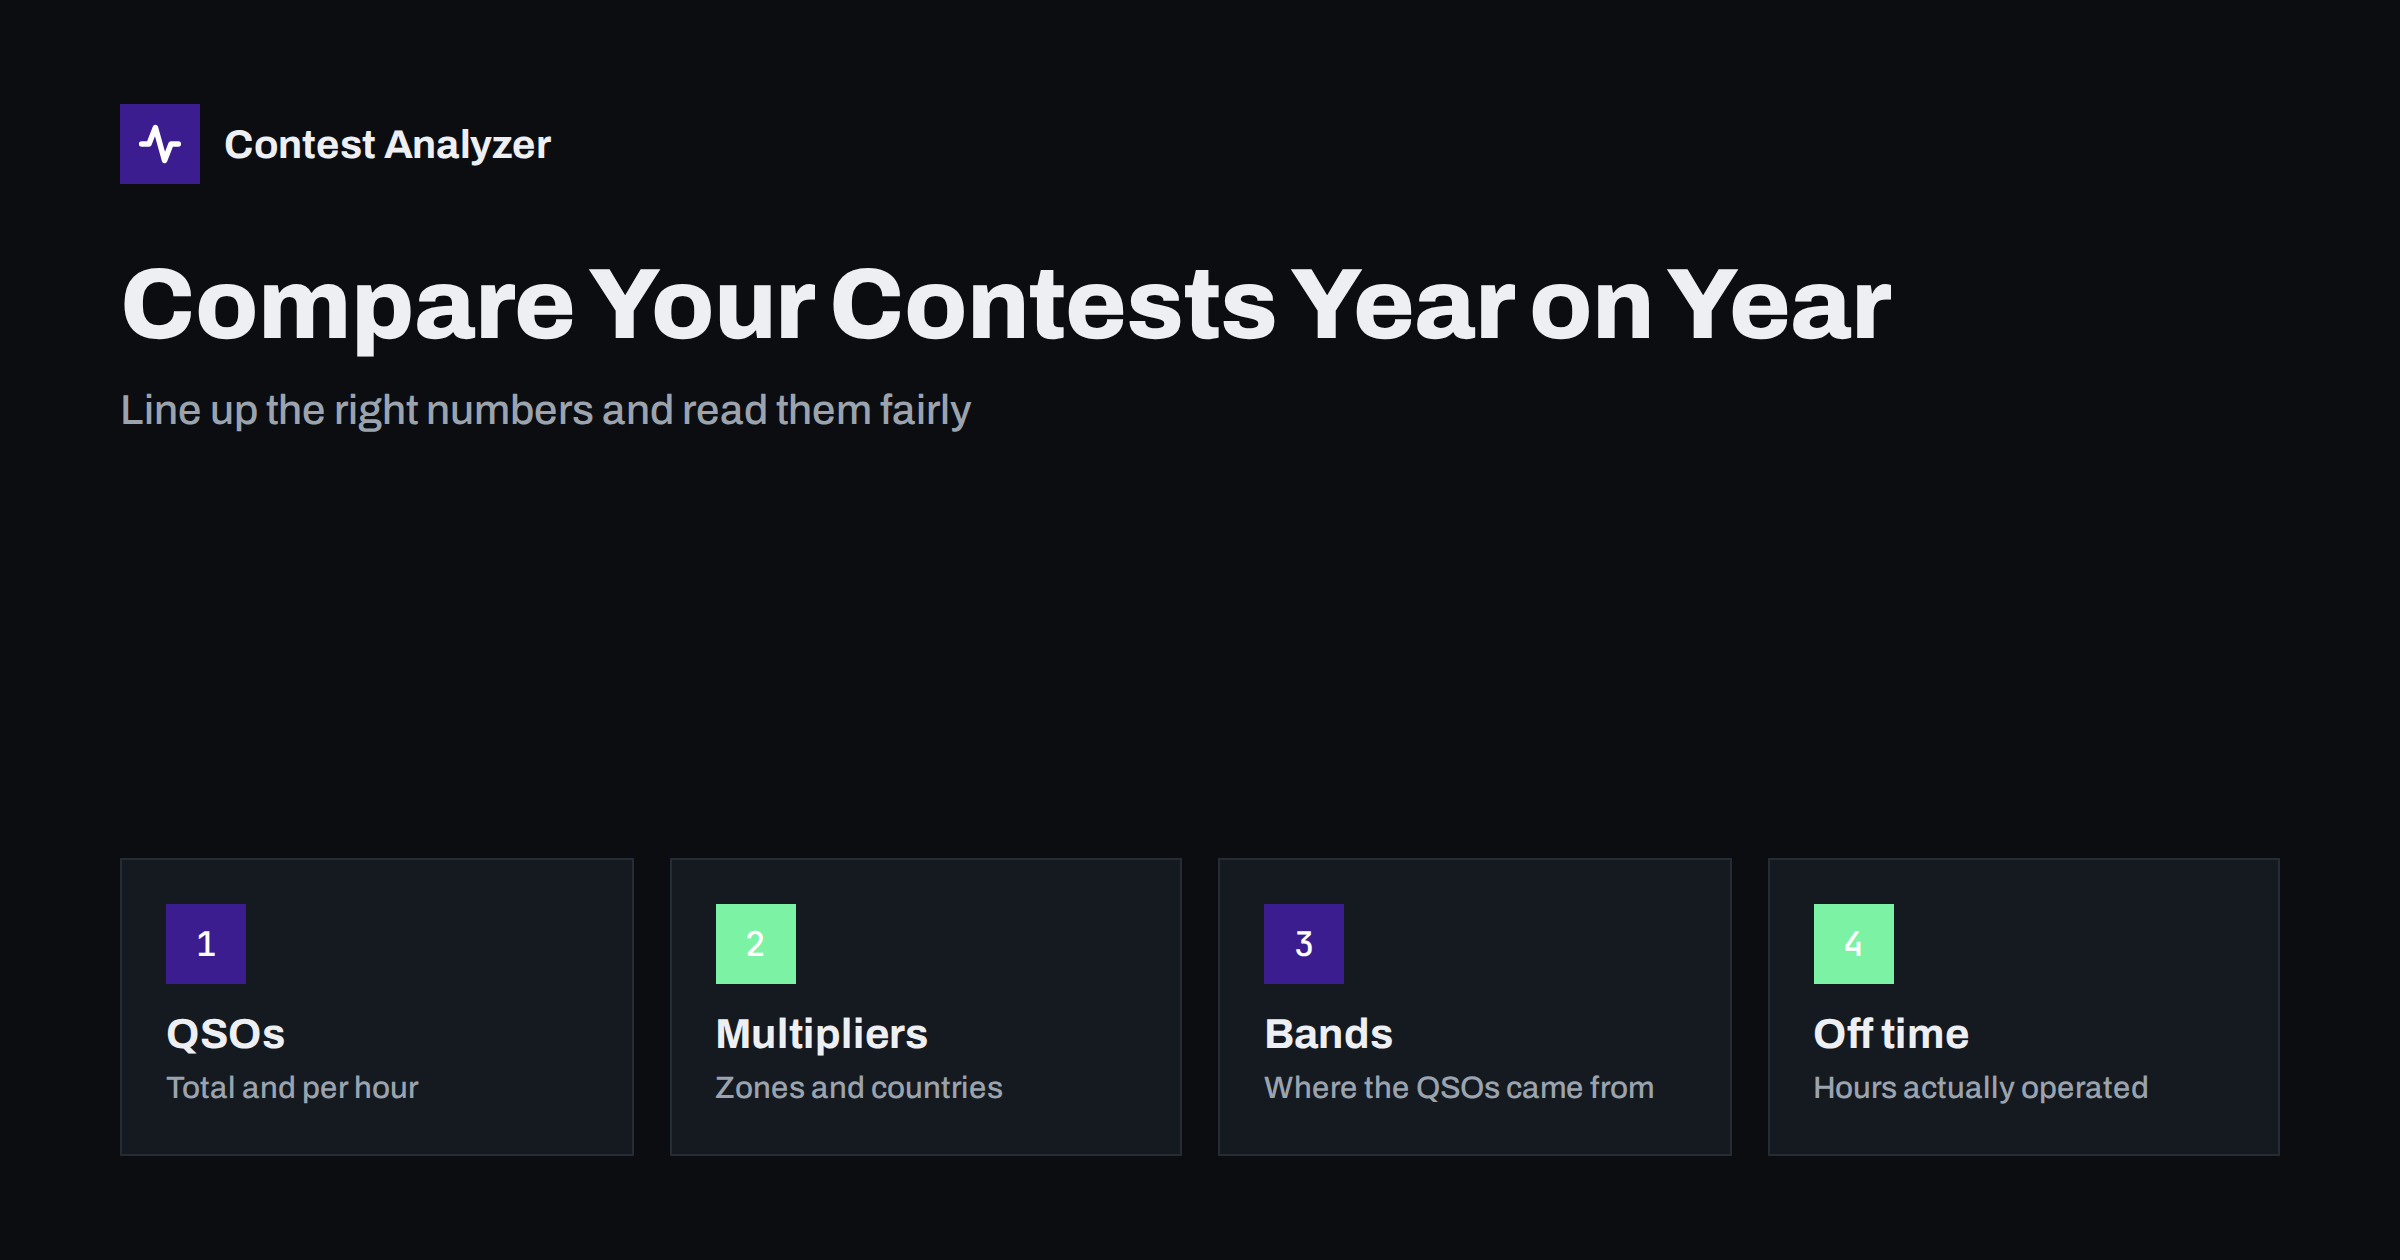
Short answer: To compare contest results fairly, put the same contest, the same category and the same mode side by side, then line up QSOs, multipliers, rates by hour, QSOs by band, continents and off time, not just the final score. Differences mean little until you allow for conditions and for how many hours you actually operated. Read the numbers as questions for next year, not as a verdict.
Why the final score is a poor comparison
The claimed score is the number everybody quotes, and it is the least informative number when you compare two years. It is a product of QSO points and multipliers, so it can rise or fall for many unrelated reasons: a better or worse solar year, a different number of hours operated, a change of antenna, a different category, or simply a weekend with different weather and noise. If your score went up by 15 per cent, you do not yet know whether you operated better or whether the bands were kinder.
The way to get more out of a comparison is to break the score into its parts and compare those. Each part points at something you can control, or something you can at least plan around.
Before you start: make the comparison fair
Three conditions need to hold before the comparison means anything.
- Same contest, same mode. A CW weekend and an SSB weekend of the same contest are different contests in practice, with different participation and different rates. Compare SSB with SSB and CW with CW.
- Same category, or a known difference. Moving from low power to high power, or from single band to all band, changes nearly every number. If the category changed, note it and treat the comparison as indicative.
- Known operating time. A contest where you operated 20 hours and one where you operated 32 cannot be compared by totals. Normalize by hours, as described below.
It also helps to write down what changed at your station between the two years: antennas, amplifier, operating position, the contest software, your location if you travelled. A short list like this turns a vague feeling into a testable idea.
The numbers worth lining up
These are the parts of a result that are useful to compare, and what each one can tell you.
| Measure | What a change may mean |
|---|---|
| Total QSOs | Overall activity, but depends heavily on hours operated |
| QSOs per operating hour | Efficiency, conditions and run frequency quality |
| Multipliers (zones, countries, prefixes) | How well you found new stations, and band choice |
| QSOs by band | Where your station and the propagation worked best |
| QSOs by continent | Antenna direction, openings and who was active |
| Off time and breaks | How many hours you really operated |
| Average distance and heading | Whether your signal reached far or stayed regional |
Normalize by operating time
The single most important adjustment is to divide by the hours you actually operated. If you made 1,800 QSOs in 30 hours one year and 2,000 QSOs in 36 hours the next, the second year looks better by total, but your rate fell from 60 to about 56 QSOs per hour. That does not necessarily mean you operated worse; the extra hours may have been spent in poor band conditions. But it is a different story from “I did better”, and it points to a different question: what did I do with the extra six hours?
To make this calculation you need a reliable picture of your off time. Many contests count only breaks above a certain length, so short pauses may count as operating time, and the rules differ between contests. We explain that in our article on off time and breaks. When you compare, use the same method for both years.
A worked example
Imagine an operator who took part in the same contest, same mode and same category two years running, with the following (invented) figures.
- Year one: 1,950 QSOs, 31 operating hours, 118 multipliers.
- Year two: 2,150 QSOs, 36 operating hours, 124 multipliers.
The totals suggest progress. Per operating hour, however, the rate went from about 63 to about 60 QSOs, and the multiplier count grew only by five despite five extra hours. The band table shows that most of the extra QSOs came from 40 metres at night, while the best daytime band lost ground. Two questions follow naturally: why did the daytime band weaken, and could the extra hours have been used better if they had been moved to the other side of the clock? Those are questions worth carrying into next year’s plan, and none of them would have appeared from the score alone.
Compare rates hour by hour, not as one average
A single average hides the shape of the contest. Put the two years side by side by clock hour. You may find that the first night was strong in both years, while the second morning was weak only in the latest one. That is a specific, actionable finding. It might be the time you slept, a band change that failed, or an opening that came earlier than expected. Our guide to reading contest rates goes deeper into the windows and the patterns to look for.
Look especially at:
- the hours of your best rate and whether they occurred at the same time of day both years;
- how quickly the rate recovered after a break;
- whether the dips fall on the same bands.
Bands, continents and multipliers
The distribution of QSOs by band tells you how your station and the ionosphere interacted. Suppose your 15 metre total halved while 40 metres grew. That suggests either a change in conditions or a change in what you did with your time. Check the dates before drawing a conclusion: solar activity changes over the years and between seasons, and a contest held at a different time of year will not behave the same.
The continent breakdown is a quick test of your antenna and your attention. If North America fell from 25 per cent of QSOs to 10 per cent, ask whether you turned the beam there less often, whether the bands closed sooner, or whether you simply spent more time on other directions. Distance and beam heading statistics help here, because they show the average reach of your QSOs and the headings you used most.
Multipliers. Compare not just how many multipliers you worked but when you worked them. A late multiplier hunt that adds five zones in the last hours can matter more than another hundred QSOs on a busy band. Check how many multipliers were worked on each band and how many appeared in the first half of the contest. If you find that many of your multipliers were one-band-only, plan to look for them on a second band next time.
Read the differences with caution
Once you have the numbers side by side, resist the urge to explain every difference. Some are real and some are noise. A sensible approach:
- Pick the two or three biggest differences, not all of them.
- For each, list at least one explanation that comes from your own choices and one that comes from conditions.
- Decide what you can test next year, such as running longer on one band or taking breaks at different times.
- Write the decision down together with the date, so you can check it later.
Do not compare against other people’s results as the main yardstick. Published scores are useful for orientation, but they come from different stations, locations and goals. The most reliable benchmark is your own earlier log from the same contest.
Doing it in practice
You can do all this by exporting numbers from each log into a spreadsheet, but it is a lot of repetitive work. Contest Analyzer builds the statistics from your Cabrillo (N1MM Logger+, DXLog or Win-Test) and offers year-on-year comparison with your own logs. It covers rates, QSOs by hour and band, countries, continents, CQ and ITU zones, WPX prefixes, distance, beam heading, and breaks and off time, so the table above is already filled in for you. See the pricing page for plans, or the list of 22 supported contests.
Related reading
- Contest rates: how to read and improve QSOs per hour
- Off time and breaks in contest rules
- How to check a contest log before you submit it
The bottom line
A year-on-year comparison is only as good as its conditions. Fix the contest, mode and category, divide by operating hours, compare hour by hour and band by band, and keep multipliers in the picture. Then choose a small number of changes to test next time. Over several seasons those small, recorded decisions add up to a clear and honest picture of your progress.
FAQ
How many years should I compare?
Two is enough to start, but three to five years of the same contest and category give a better picture, because a single year can be unusual for reasons outside your control.
Is it fair to compare an SSB result with a CW result?
Not directly. Rates, participation and multiplier patterns differ by mode, so compare like with like and treat any cross-mode comparison as rough.
What should I do if my category changed?
Compare the parts that are less category-sensitive, such as QSOs per hour or the shape of the hourly curve, and note the category change next to the numbers.
Does a lower score always mean I operated worse?
No. Fewer hours, poorer propagation or a different category can all lower the score. Look at QSOs per operating hour and at your multipliers before you decide.
Can I compare logs from different contests?
Some measures, such as hourly shape, band distribution and off time, can be compared across contests, but scores and multipliers cannot because the rules differ.